Download
1 / 8
80 likes | 95 Vues
This report discusses the hardware setup and goals of the online monitor for continuous real-time monitoring of the Calibration Unit (CU) behavior and performance, as well as beam diagnostics. The report also provides an overview of the code structure and available plots. The tutorial covers event statistics, TKR and CAL subsystem plots, and practical tips for using the monitor.

E N D
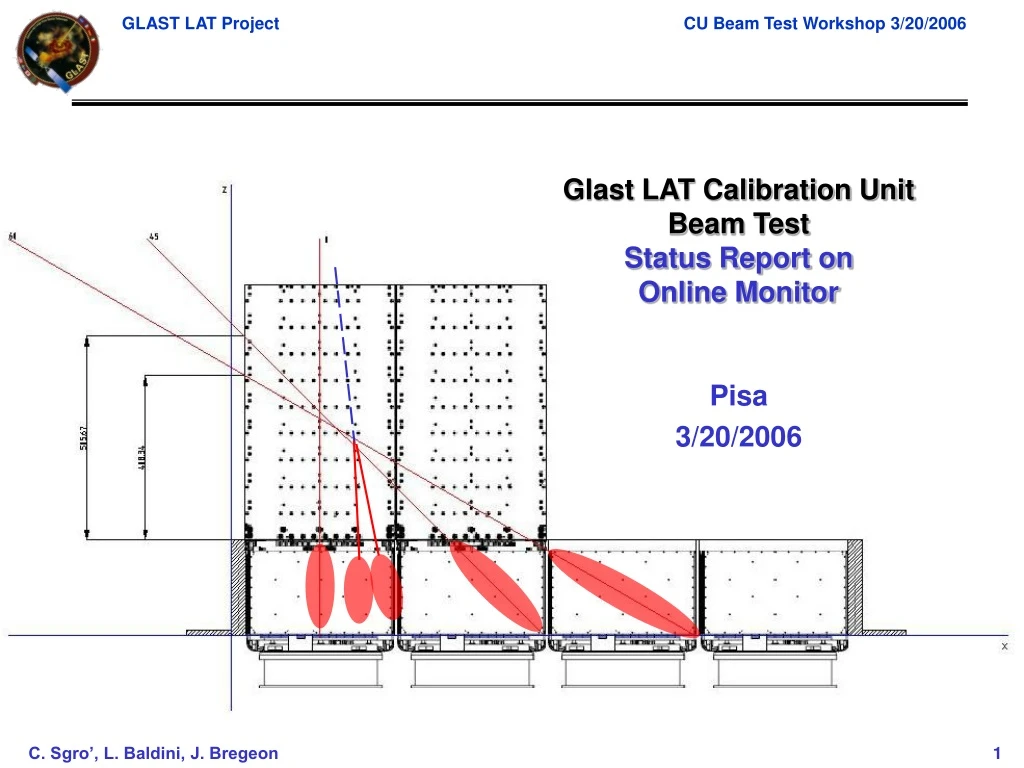
Glast LAT Calibration Unit Beam TestStatus Report on Online Monitor Pisa 3/20/2006
NIM crate (ext trigger logic) GASU Scintillators (for external trigger) VME Tower (Tkr+Cal+TEM) Single Tray (for multiple TEM testing) Ext Trigger box Hardware setup
Online Monitor goals • Continuous real time monitoring of the CU behavior/performance: • Definition of a basic set of standard distributions at the global (CU) level and the subsystems (TKR, CAL, ACD) level. • Few simple quantities as sensitive as possible to problems/malfunctioning. All the remaining analysis should be performed offline. • Minimize the impact onto the data acquisition in terms of required processing power. • Playback capability. • Beam diagnostic: • Plots sensitive to beam caracteristics/failures (…Not an event display, nor online analysis)
General structure: overview of the code • Python core, qt user interface, Hippodraw plots • All packages are supported by Online group. • Only requires LATTE • Event readout based on: • DataDistributor technology in Run Control. • LDF data multicasting over network. • Online Monitor run on a separate PC: no impact on DAQ performances. • Multiple monitors can be setup with different parameters/plots. • LDF file. • Full run reprocessing. • Modular architecture based on a single configuration file • Can work with several hardware configuration, from 1 module to full LAT • Very easy to add, modify or move plots (few minutes work) • But… kids, don’t try this at home!
Event Statistics Subsystem Plots: Tkr, Cal selection tab & Twr selection button General plots Trigger, timing and fast track recon How it looks like • 6 general plots • 4 plots for each subsystem (TKR, CAL, ACD ?). • Events statistics to check monitor efficiency and DAQ settings. • Simple operation: Start, Stop and Reset plot button. • Hippodraw Inspector available to change plot parameters. • Tool Tips for online help on plots. These plots refer to CR run with muon telescope as trigger
Zoom on TKR plots Number of hits per event • Check for beam profile. • Check for empty event. • Check for broken plane or GTFE (dead or noisy) • Hard to see problems at the strip level, this requires offline analysis. Free space for other plots Hit profile inside the tracker, XZ and YZ projection
Zoom on CAL plots Number of logs hit per event Sum of hit logs energy (fast calibration) Hit profile inside the Cal, XZ and YZ projection • Check for beam profile. • Check for log failure. • Raw energy calculation based on simple, linear calibration. • All readout modes (4range, ZS) are supported.
Work in progress : to do list • Still some bugs to understand and fix. • File readout to be improved (used only for debug now). • Plot saving to be implemented. • For final report and saving interesting behaviour in case of problems. • Speed improvement. • Now we estimate a max rate of ~100 Hz for CU • Include ACD (?). • Not in pisa yet. • Easy to include ancillary system if the data are available from DataDistributor. • Usefull plots…some suggestions? And now a practical tutorial…