Download
1 / 21
210 likes | 299 Vues
This research by T. Staeger, J. Grieser, and C.-D. Schönwiese from Goethe University, Frankfurt, analyzes global temperature variations (1856-2003) to distinguish natural and human-induced influences. Using regression models and forcings like GHG, SOL, SOI, and more, the study dissects signal components from noise to quantify their impacts on climate change.

E N D
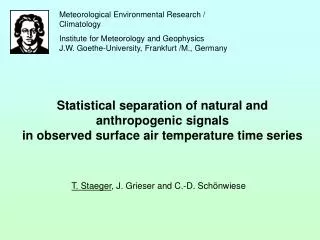
Meteorological Environmental Research / Climatology Institute for Meteorology and Geophysics J.W. Goethe-University, Frankfurt /M., Germany Statistical separation of natural and anthropogenic signalsin observed surface air temperature time series T. Staeger, J. Grieser and C.-D. Schönwiese
Global mean temperature 1856 – 2003 after P.D. Jones et al. Which parts of the variations in observed temperature are assignable to natural and anthropogenic forcings? Are anthropogenic signals distuingishable from noise?
Stepwise Regression Approach: Causes for the structures in the time series under consideration are being postulated. The effects are seen to be linear and additive. A pool of potential regressor time series is collected out of the forcings / processes considered. A selection routine is applied to obtain a multiple linear regression model.
Forcings / processes considered: - Greenhouse gases (GHG) - Tropospheric sulphate aerosol (SUL) - El Niño - Southern Oscillation (SOI) - Explosive volcanism (VUL) - Solar forcings (SOL) - North atlantic oscillation (NAO)
global mean temperature 1878 – 2000, annual mean after P.D. Jones GHG + SOL + SOI + VUL explained variance: 78.9%
explained variance of the complete model and and for single forcings on the global mean temperatur 1878 - 2000
What is noise? Case 1: noise represents chance: To obtain the component representing chance, the residual is separated into a structured and unstructered component. The question to be answered here: Is the greenhouse signal distuingishable from chance?
What is noise? Case 2: noise comprises of natural variability and unexplained variance The question to be ansewered here: Is the greenhouse signal distuingishable from variability of non-anthropogenic origin?
EOF-Transformation PC backtransformation signal fields, residual field Stepwise Regression Treatment of data fields: data field
GHG signal field, seasonal means for 2000 relative to 1901 in [K]: NH winter NH spring NH summer NH autum
Explained variance of the full model and of single forcings for the global temperature data field 1878 - 2000
Significance of the GHG signal for 2000 relative to 1901 in percentages: Case 1: noise represents chance Case 2: noise = natural variability + unexplained
Significance of the european GHG signal for 2000 relative to 1878 in percentages: Case 1: noise represents chance Case 2: noise = natural variability + unexplained
Signficance of the GHG signal in the german mean temperature 1878 - 2000: Case 1: noise represents chance
Signficance of the GHG signal in the german mean temperature 1878 - 2000: Case 1: noise = natural variability + unexplained
Conclusions: Explained variance is highest in global and hemispheric mean temperatures (ca. 70% - 80%) and is reduced in data sets with high spacial resolution. On the global scale, GHG forcing is most important and significant. On the european scale NAO is dominant – GHG forcing is not significant. Time moving analysis shows a growing meaning of GHG forcing compared to natural forcings, especially since around 1985 on the global scale.