Download
1 / 2
20 likes | 135 Vues
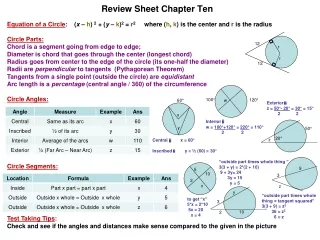
Lines Review Sheet. Line Facts : Slope is the ratio of the rise (the change in y values) over the run (the change in x values) positive slope rises to the right; negative slope falls to the right

E N D
Lines Review Sheet Line Facts: Slope is the ratio of the rise (the change in y values) over the run (the change in x values) positive slope rises to the right; negative slope falls to the right rise ∆y y2 – y1 distance up (+) or down (-) Slope = m = ------------ = ------ = -------------- = --------------------------------------- run ∆x x2 – x1 distance right (+) or left (-) Horizontal line: m = 0 y = k Vertical Line: m = undefined x = h 3 Forms of Lines are talked about: Slope-Intercept Form: y = mx + bm is slope and b is y-intercept Point-Slope Form: y – y1 = m(x – x1) or y – k = m(x – h) for point (h, k) Standard Form: Ay + Bx = C slope = -B/A and y-intercept = C/A Using basic algebra we can manipulate all forms into slope-intercept form (the form our calculator has to have to graph with). To do this we must get the equation to be in the form of y = (y by itself on one side and everything else on the other side) To find the y-intercept set x = 0 To find the x-intercept set y = 0 and solve for y = and solve for x = Relationships to other Lines (lines a and b): Parallel lines have the same slope ma = mb Perpendicular lines have negative reciprocal slopes ma = -1/mb Example: Given the line y = 3x – 7 (already in slope-intercept form) slope y-intercept = -7 Find the slope of a line parallel and perpendicular Parallel – slopes are the same so parallel slope is 3 Perpendicular – slopes are negative reciprocals so perpendicular slope is -1/3 To change line forms to slope intercept form: Examples Point-slope Form: Equation forms: slope = 3, point (2, 4) y – 4 = 3(x – 2) 8x = 4y - 15 y – 4 = 3x – 6 (distribute the 3) 8x + 15 = 4y (add 15 to both sides) y = 3x – 2 (add 4 to both sides) 2x + 15/4 = y (divide both sides by 4) slope= -2, point (2, -5) y + 5 = -2(x – 2) 2x + 3y = 9 y + 5 = -2x + 4 (distribute the -2) 3y = 9 – 2x (subtract 2x from both) y = -2x – 1 (subtract 5 from both sides) y = 3 – 2/3x (divide both sides by 3) (x2, y2) ∆y (x1, y1) ∆x
Lines Review Sheet Reading information from the graph of a line: Where the line crosses the vertical axis (y-axis) is the y-intercept [-2 in example] Where the line crosses the horizontal axis (x-axis) is the x-intercept [1 in example] Determine the slope by drawing a right triangle from two points where the line crosses the grid at a corner point and counting the vertical blocks (for the rise) and the horizontal blocks (for the run) [rise = 8 and run = 4 so the slope is 8/4 = 2] If we are given just two points (-1, -4) and (3, 4) we can graph them to figure out the slope or we can use the ∆y / ∆x equation to figure out the slope: ∆y y2 – y1 4 – (-4) 4 + 4 8 Slope = m = ------ = -------------- = ------------- = ---------- = ----- = 2 ∆x x2 – x1 3 – (-1) 3 + 1 4 Our TI calculator and lines: We can also use our calculator to figure out slope and the equation of the line if we are given two points. Put x-values in L1 and y-values in L2 (STAT EDIT) and then use LinReg ax+b to calculate the line (STAT CALC 4 ENTER 2nd 1 , 2nd 2 ENTER) We can also use the calculator to graph a line, if its in slope-intercept form: Hit ‘Y=‘ and type the equation in (use the X,T,Θ,n key to put X in) Hit WINDOW and put in the limits of the graph to match the paper (below it would be Xmin= -6, Xmax= 6, Xscl=1, Ymin= -6, Ymax=6, Yscl = 1, Xres=1) Hit GRAPH To graph a line by hand: Geometry says we need just two points to graph a line If given two points, plot them and connect them usinga straight edge. Determine slope and intercepts if needed If given the y-intercept form of the line, then plot the y-intercept point and then find the next point by using the slope and then connect the two point Example: plot y = (2/5)x + 1 slope is rise over run so up 2 and over 5 Example (3, 4) 1 2 3 ∆y 4 5 6 7 (-1, -4) ∆x 8 1 2 3 4 up 2 over 5