Download
1 / 17
170 likes | 379 Vues
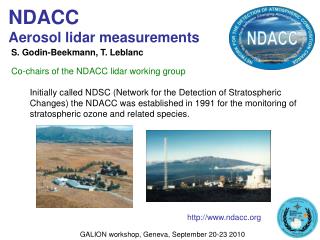
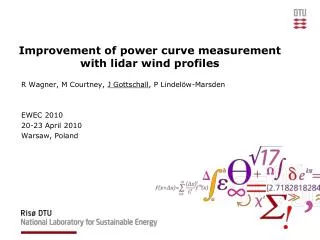
Chris Slinger, Matthew Leak, Mark Pitter, Michael Harris ZephIR Ltd, Ledbury, Herefordshire, HR8 1EU, UK. Relative power curve measurements using turbine mounted, continuous-wave lidar. Power curve measurements for turbines. Power curves important for measuring turbine performance

E N D
Chris Slinger, Matthew Leak, Mark Pitter, Michael HarrisZephIR Ltd, Ledbury, Herefordshire, HR8 1EU, UK Relative power curve measurements using turbine mounted, continuous-wave lidar
Power curve measurements for turbines Power curves important for measuring turbine performance IEC Standard 61400-12-1 describes measurement procedures for absolute power curves • Require hub height measurement of free stream wind incident on the turbine (2D upwind of turbine) • Current standard requires hub height metmast • New, draft standard IEC 61400-12-1 CD • Ground based lidar supplemented by short metmast • Concept of rotor equivalent wind speeds Relative power curves • Broader range of measurement techniques applicable • Measurements can be made in the blade induction zone • Allow comparison of turbine performance pre- and post- intervention/adjustment/maintenance • Can quantify relative performance improvements Rotor equivalent wind speed concept. Graphic credit: I. Antoniou
Advantages in using turbine mounted lidar for power curve measurements Measurement of wind incident on turbine irrespective of wind direction Low cost and convenient compared to metmast • Rapid deployment (½ day) • On- and off-shore • Long life, low maintenance Measurements at multiple ranges Circular scanned lidars permit measurement of a variety of wind field quantities around rotor disk • Hub height and rotor averaged horizontal wind speeds • Wind yaw alignment relative to turbine • Vertical wind shear • Wind veer (variation of wind direction with height) • TI and other turbulence measures • Wind field complexity • Turbine wakes and effects of complex terrain • Horizontal shear and inflow angle ZephIR turbine wake visualisation example
Operating principles of a CW scanning lidar † Continuous wave (CW) lidar beam focussed at user set range(s) upstream of the turbine • 10 m to 300 m ranges Measure Doppler shift of light backscattered from aerosols Circular scan in plane of the rotor • 1 scan per second • 50 readings per scan LOS readings combined with a wind model to yieldwind field measurements Advantages of CW lidar include • High sensitivity in all atmospheres • Fast sample and integration times (20 ms) • Sensitivity independent of range • Short range of operation possible (down to 10 m) • Class 1 eye safe operation Pulsed lidars are an alternative for longer ranges † ZephIR 300 parameters
Trial description Aim • To demonstrate and quantify turbineperformance improvements after turbine tuning NEG-Micon turbine, 2 MW, 72 m rotor Ø Flat terrain, Eastern Jutland Nacelle roof mounted, dual mode, ZephIR 300 CW lidar Ranges R of 10m, 30m, 50m, 100m and 180m (i.e. 2.5 Ø) Trial organised by ROMO Wind First part of trial (03 January to 15 March) • Unoptimised turbine Second part of trial (15 March to 5 April) • Reoptimised turbine Photo credit:ROMO Wind
Example of data measured, 10 minute averaged ZephIR lidar 10 m range data Unfiltered scatter plot shown (includes turbine shut down events) 2 MW generator }500 kW generator
Yaw misalignment detection • Yaw error of 14°to 16°evident in CW lidar yaw alignment measurements Remedied by nacelle wind vane recalibration Effects clearly visible in ZephIR measured power curves pre- and post- yaw recalibration ROMO Wind estimated improved AEP of ~5% after yaw recalibration After turbine yaw recalibration 15march2012 Turbine yaw recalibrated Measured yaw misalignment / Before turbine yaw recalibration Time All power curves in this presentation are hub height (HH), corrected for air density, as specified in IEC 61400-12-1 Error bars shown are for standard uncertainty
Wind shear and turbulence effects Plots of HH powercurves filtered for high and low vertical wind shear(with inset of shear statistical distribution) Shear and TI determined from lidar measurements Results consistent with other hub height power curve studies Measurement of shear, TI, and veer is important for accurate power curve determination • Plots of HH powercurves filtered for high and low TI(with inset of TI statistical distribution) Turbine power output /W Turbine power output /W Wind speed measured by ZephIR at a range of 180m /ms-1 Wind speed measured by ZephIR at a range of 10m /ms-1
Measurement of blade induction effects Blade induction effects slow wind speed as wind approaches the blades Windspeed /ms-1 Lidar scan ranges Time /10 min intervals
Measurement of blade induction effects Effect clearly visible in relative power curves derived at different ranges Measurement scatter increases slightly with range First known lidar measurement of close-in blade induction effects Ranges Turbine power /W Turbine power /W Wind speed /ms-1 Wind speed /ms-1 Unfiltered multi-range scatter (left, with turbine manufacturer’s power curve) and binned power curves (right)from a nacelle-mounted ZephIR. 25 days data, post wind vane recalibration.
Practical lessons learned from turbine mounted lidar trials Lidar must be small enough to fit through turbine hatches and turbine internal spaces • < 0.55 m x 0.55 m cross section Lidar must be of low enough mass for easy 2 man deployment • < 40 kg Mounting system must be safe to use, and capable of being used on a variety of nacelle roofs • Adjustable carbon fibre tripod frame On-lidar aids for alignment with turbine axis are important if lidar is to be used for turbine yaw optimisation • Visible laser projection system • Measurements must be made at ±2½ % of hub height (±1 % in new draft standard) • Electronics levels with real time readout and logging Flow across full rotor needed for accurate turbine performance determination • Ability to measure vertical shear, TI, veer and rotor equivalent wind speeds
Other applications of turbine mounted lidars Turbine control Significant potential for turbine load reduction using turbine mounted lidar Maximum advantages will be accrued using turbines designed to incorporate fully lidar systems Reduced energy generation costs “Both pulsed and continuous-wave LIDAR types are suitable, as long as they can sample something like 10 points distributed around the swept area every second or so and provide a few seconds of lookahead time.”† Experimental verification of benefits of lidar controlled turbines is still underway Example study results DEL = damage equivalent load DEL reductions as a function of wind speed Lifetime DEL reduction (tower base loads) † ”Wind turbine control applications of turbine-mounted LIDAR”, Bossanyi et al, DEWEK 2012 Graphics credit: Bossanyi et al, Garrad Hassan
Power curves with CW lidar: conclusions A ZephIR CW lidar has been used to identify, verify and quantify improvement in turbine performance Relative and absolute turbine power curves were determined Yaw misalignment, wind shear and TI were measured and have a significant effect on hub height power curves Blade induction effects and their impact on relative power curves were measured CW scanned lidars will allow further improvements in power curve measurement statistics • Use of rotor averaged wind quantities • Wind veer effects Longer term CW lidar developments promise much for turbine control applications New dual-mode ZephIR CW lidar, undergoing final tests in Denmark
Thank you for your attention Chris Slinger Zephir Ltd chris.slinger@zephirlidar.com +44 1531 650 757 For further information, please contact New, turbine optimised , ZephIR DM launch Monday @ 5 pm Stand A-D40, Natural Power / Zephir Acknowledgements The authors would like to acknowledge the cooperation and assistance of ROMO Wind A/S www.romowind.com
From measurements to wind quantification (1) Fitting a wind model to multiple measurements Least-squares fit (LSF) of a wind model applied to measured LOS speeds Standard outputs are horizontal wind speed, vertical shear and yaw alignment • Wind speeds at any height across the rotor disk. Excellent basis for rotor-equivalent wind speeds Secondary outputs include quantification of flow complexity and TI Extraction of other wind quantities possible e.g. inflow, horizontal shear Benefits of the above approach include aggregated analysis of complex wind flow conditions
From measurements to wind quantification (2) pairwise algorithms Pairs of LOS values, e.g. from each scan at hub height, are used to determine horizontal wind speed and yaw misalignment • No direct output of wind shear. Indirect output by considering multiple pairs. Can be extended to determine wind veer Well suited to hub and rotor equivalent wind speeds and veer Real time tilt/roll measurement ensures LOS always available at specified heights Pairwise algorithm chooses slice using logged tip-tilt angles to ensure hub height wind speed measurements with high availability Wind veer example,(also showing turbine blades, prior to blade filtering)