Download
1 / 29
290 likes | 446 Vues
Positioned For The Cyclical Upturn 15 th Annual Smith Barney Citigroup Chemical Conference December 7, 2004 Dan F. Smith President and Chief Executive Officer. Safe Harbor Language.

E N D
Positioned For The Cyclical Upturn15th Annual Smith Barney Citigroup Chemical ConferenceDecember 7, 2004Dan F. SmithPresident and Chief Executive Officer
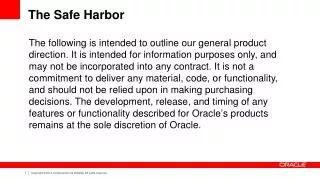
Safe Harbor Language Statements in this presentation relating to matters that are not historical facts are forward-looking statements. These forward-looking statements are just predictions or expectations and are subject to risks and uncertainties. Actual results could differ materially, based on factors including but not limited to the cyclical nature of the chemical and refining industries; availability, cost and volatility of raw materials and utilities; governmental regulatory actions and political unrest; global economic conditions; industry production capacity and operating rates; the supply/demand balance for Lyondell's and its subsidiaries’ and joint ventures' products; competitive products and pricing pressures; access to capital markets; and technological developments and other risk factors. For more detailed information about the factors that could cause our actual results to differ materially, please refer to Lyondell Chemical Company’s Annual Report on Form 10-K for the year ended December 31, 2003, Lyondell’s Quarterly Report on Form 10-Q for the quarter ended September 30, 2004, Lyondell’s Annual Report on Form 10-K for the year ended December 31, 2004, which will be filed in March 2005, Millennium Chemicals Inc.’s Annual Report on Form 10-K, as amended, for the year ended December 31, 2003 and Millennium’s Quarterly Report on Form 10-Q for the quarter ended September 30, 2004. Reconciliations of GAAP financial measures to non-GAAP financial measures are provided at the end of this presentation.
Lyondell Has Built a Major Global Chemical Enterprise • Global producer of basic chemicals, polymers, and fuels • Built one of the world’s leading chemical companies through: • Acquisitions and joint ventures • New investment where differential • Our value proposition • Excel at low-cost operation in a mature industry • Return cash flow to investors: • Dividends and interest • Debt reduction
LCR/Refinery Upgrade Partnered With PDVSA Equistar 2 Oxychem Joins Equistar Partnership Bayer Divested Polyols Business to Bayer PO & BDO Europe LYO & MCH Combine Alathon Purchase Acquired HDPE Assets From Oxychem Lyondell Has Followed A Consistent Path Over The Years Growth Integration Consolidation Rexene Polymers Purchase of LDPE & PP Assets 1985 Formation: ARCO Olefins, Houston Refinery 1985-95 2000 2001-03 1996-97 1999-00 2004 1998 Merged Structure Combined Management of Equistar and Lyondell Equistar 1 Joined With Millennium toForm Equistar Increase Equistar Ownership Purchased Oxy’s Share of Equistar ARCO Chemical Purchased ACC
Total Chemical Leverage Per Share Has Increased Pounds / Share Notes: Lbs refers to capacity times ownership percentage. 19942004Post-closing share assumption Share Count 80 MM 177 MM 242 MM
Leading Product Positions Create Significant Earnings Leverage Intermediate Chemicals and Derivatives Equistar Millennium 1 Source: Capacities as of January 2004, CMAI, SRI 2 Does not include refinery-grade material or production from the product flexibility unit at Equistar’s Channelview facility. 3 Based on 1¢/gal change
14.0% 12.0% 8.9% 10.0% SG&A + R&D, %Sales 8.0% 6.0% 4.2% 4.0% 2.0% 0.0% LYO+EQU Peers Lyondell Equistar PO11 Spending Regulatory 180 150 120 90 60 30 0 Operational Excellence Is A Priority Safety Performance LYO & EQU Incident Rate Average SG&A and R&D, % Sales 2000 - 2003 2 Peers include: Dow, Nova, Eastman, Celanese, Solutia, Westlake, Millennium, Georgia Gulf 1.5 1st Quartile ’03 0.97 1.18 0.99 Recordable Injury Rate 1 0.8 0.52 0.52 0.5 0 1999 2000 2001 2002 2003 Capital Spending Days of Working Capital * Days $MM 2004 Budget 1999 * Based on accounts receivable (including those sold), inventories & accounts payable as of 12/03, and fourth-quarter days of sales.
Our Products Are Basic Necessities In Developed Economies 2003 Sales Revenue * Includes Millennium and proportional share of LCR
3rd Largest Chemical Company in North America (Post-Transaction) 2003 Sales ($ in millions) $35,000 $30,000 $25,000 $20,000 $15,000 $10,000 $5,000 $0 LZ EC CK VAL DD RPM ALB ECL POL CYT GLK HPC NCX ARJ FUL EMN FOE PPG DOW WLM ROH SHW SHLM Pro Forma Lyondell
The TiO2 Business Has A Broad Global Reach Ashtabula, OH Baltimore, MD Stallingborough, UK Le Havre, France Thann, France Bahia, Brazil Paraiba, Brazil (Mine) Kemerton, Australia Bunbury, Australia
Demand – 4.1 MM mtpa; $8 billion Capacity – ~4.8 MM mtpa TiO2 Demand and Supply Geographical Region End-Use Market Capacity Source: Lyondell Estimates and Published Information
Global TiO2 Capacity Additions Have TypicallyUtilized Chloride Technology Source: Lyondell, Published Information
Product Attributes End use dependent Better purity and particle size control Finishing is similar Process Attributes Continuous process Fewer process steps Fewer people Smaller facility footprint Less waste produced Approximately 75 Percent Of Our TiO2 Capacity Is Based On Chloride Technology
There Are Minimal Announced TiO2 Capacity Additions Operating Rate M Tonnes Demand Capacity Source: Lyondell
The Ethylene Outlook Is Quite Strong Source: CMAI / Lyondell (September 2004)
2003 2004 Effective Ethylene Operating Rates Have Surpassed 95 Percent U.S. Ethylene Supply/Demand 2005 CMAI-11/04
Liquid Cracking Provides an Advantage vs. Ethane Raw Materials Liquid Cracking Variable Cost Advantage vs. NGL Ethane – Light Naphtha Cost of Ethylene Spread Lyondell Capability NGL 37% Liquid 63% Average ¢/lb ethylene N. American Industry (ex. Lyondell) Liquid 25% NGL 75% Source: CMAI, Chem Data, and Lyondell
Co-Product Prices Have Increased More Rapidly Than Raw Material Costs Crude Oil-Based Raw Materials Naphtha Cracking Product Yield Source: CMAI, Lyondell Estimates
Future Ethylene Capacity Additions Favor A Strong Liquid Raw Material Advantage 2004 – 2009 2003 Demand Olefins Plant Demand Growth Supply Growth Δ BlbsBlbsBlbsBlbs Ethylene 226 56 55 (1) Propylene 134 38 15 (23) Ethylene / Propylene 1.7 1.5 3.7 -- Source: CMAI September 2004
Despite Significant Integration, the Lyondell System Is Long In Key Building Block Chemicals Source: Lyondell
Lyondell Has Benefited From Increased Refining Margins WTI Crude Oil Refining Margin Source: Platt’s
Additionally, LCR Has Benefited From An Expanded Heavy Sour Crude Discount WTI Crude Minus Maya Crude $/Bbl Source: Platt’s
Our Results Reflect Improving Conditions EBITDA $MM Quarterly EBITDA * Excludes $103 MM of asset impairment charges at Millennium.
Lyondell’s Earnings Capability Far Exceeds Recent Results Cycle EBITDA potential (current ownership) Peak Pre- Recession Recession/ Trough 2003 1 Proportional Interest, Dividends & Capital 2 1 3 1 1 CMAI industry and LYO margin conditions for IC&D and Equistar products (ex. MTBE) applied to current capacities and ownership, LCR 2003 EBITDA, Millennium 2003 EBITDA. Note: Assumes 2003 debt levels and 242 MM shares. 2 Same as 1995 except 1988 CMAI industry margins for Ethylene, PE and Styrene. 3 Combined pre-acquisition EBITDA.
De-Leveraging Benefits All Stakeholders Impact of Lyondell debt reduction at constant capitalization1$3 Billion Debt Reduction Debt to Capitalization 45% Avoid Interest Expense $300MM / Year Earnings Improvement 80¢ / share Share Price Improvement at $12.40 / share 2 Constant Capitalization 1 Capitalization = debt + book value of equity + minority interest 2 Assumes 242MM shares outstanding
* Includes asset impairment charge of $103, reorganization, office and plant closure costs of $18 and $5 minority interest.