Download
1 / 13
130 likes | 277 Vues
Sustainability of Sales Tax as a Revenue Source Economic and Demographic Effects in 2 Colorado Cities Wilson D. Kendall Center for Business and Economic Forecasting, Inc. August 6, 2007. Overview. Part of long-term fiscal outlook study for Aurora and Boulder

E N D
Sustainability of Sales Tax as a Revenue Source Economic and Demographic Effects in 2 Colorado Cities Wilson D. Kendall Center for Business and Economic Forecasting, Inc. August 6, 2007
Overview • Part of long-term fiscal outlook study for Aurora and Boulder • Colo. Tax burden weighted toward locals (Colo. 2nd largest local share) • Heavy dependence on sales tax (Colo. 5th largest sales tax share of local taxes)
Methodology • Projected sales tax by type of payer (Households, Business, etc.) • Estimate household expenditures on taxable items by age and income • Project growth in households by age and income & adjust for real income growth and inflation • Non-household tax projected based on job growth (businesses), homebuilding (construction), etc.
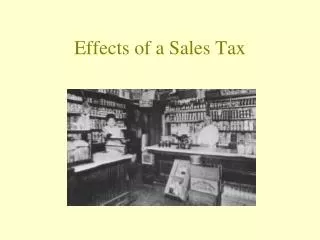
As population ages, expenditures on items in tax base diminish
Proportion of older households will increase(Boulder Households)
Expenditures on taxable items by age-Boulder & US Source: BLS Consumer Expenditure Survey and Boulder HH estimates.
Spending on taxable items doesn’t keep pace with income Source: BLS Consumer Expenditure Survey & Boulder tax base
Inflation is lower for items in sales tax base Based on Boulder tax base
Growth in portion of sales tax paid by households lags expenditures Boulder & Aurora-HH per capita sales tax Gov Exp-US per capita state & local govt. expenditures
Aurora sales tax growth falls short of index of govt. expenditures “S&L Gov Exp” is projected US per capita state & local govt. expenditure
Boulder sales tax growth stronger than Aurora due to smaller aging effect “S&L Gov Exp” is projected US per capita state & local govt. expenditure
Options for local governments • Change residential development patterns • Increase retail development • Broaden tax base • Major structural changes in local finance