Download
1 / 45
470 likes | 1.07k Vues
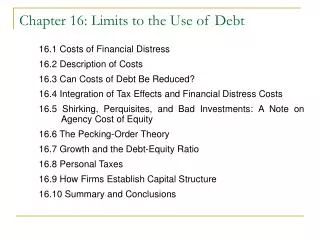
Chapter 16: Limits to the Use of Debt. 16.1 Costs of Financial Distress 16.2 Description of Costs 16.3 Can Costs of Debt Be Reduced? 16.4 Integration of Tax Effects and Financial Distress Costs 16.5 Shirking, Perquisites, and Bad Investments: A Note on Agency Cost of Equity

E N D
Chapter 16: Limits to the Use of Debt 16.1 Costs of Financial Distress 16.2 Description of Costs 16.3 Can Costs of Debt Be Reduced? 16.4 Integration of Tax Effects and Financial Distress Costs 16.5 Shirking, Perquisites, and Bad Investments: A Note on Agency Cost of Equity 16.6 The Pecking-Order Theory 16.7 Growth and the Debt-Equity Ratio 16.8 Personal Taxes 16.9 How Firms Establish Capital Structure 16.10 Summary and Conclusions
M&M Assumptions • Homogeneous expectations. • Homogeneous business risk classes. • Perpetual cash flows: V = CF/r. • Perfect capital markets • No market frictions: • corporate or personal taxes, • issue costs, • transactions costs, • costs of financial distress.
The Modigliani-Miller Capital Structure Propositions NO TAX CASE: Proposition I: VL = VU Proposition II: rS = r0 +(B/S)(r0-rB) WITH CORPORATE TAXES: Proposition I: VL = VU + TCB Proposition II: rS = r0 +(B/SL)(1- TC)(r0-rB)
MM Theory with Taxes VL = VU + TCB • implies firms should issue nearly all debt financing. Extensions • personal taxes • financial distress costs
Costs of Financial Distress • Bankruptcy risk versus bankruptcy cost. • The possibility of bankruptcy has a negative effect on the value of the firm. • However, it is not the risk of bankruptcy itself that lowers value. • Rather it is the costs associated with bankruptcy. • It is the stockholders who bear these costs.
Costs of Financial Distress • Direct costs • Indirect costs • Financial distress costs result in an interior solution in the determination of optimal capital structure. VL = VU + PV(tax savings)-PV(costs of financial distress)
Costs of Financial Distress • Direct Costs • Legal and administrative costs • Indirect Costs • Impaired ability to conduct business (e.g., lost sales) • Selfish strategy 1: Incentive to take large risks • Selfish strategy 2: Incentive toward underinvestment • Selfish Strategy 3: Milking the property
Balance Sheet for a Company in Distress Assets BV MV Liabilities BV MV Cash $200 $200 LT bonds $300 Fixed Asset $400 $0 Equity $300 Total $600 $200 Total $600 $200 What happens if the firm is liquidated today? $200 $0 The bondholders get $200; the shareholders get nothing.
Selfish Strategy 1: Take Large Risks The Gamble Probability Payoff Win Big 10% $1,000 Lose Big 90% $0 Cost of investment is $200 (all the firm’s cash) Required return is 50% Expected CF from the Gamble = $1000 × 0.10 + $0 = $100
Selfish Stockholders Accept Negative NPV Project with Large Risks • Expected CF from the Gamble • To Bondholders = $300 × 0.10 + $0 = $30 • To Stockholders = ($1000 - $300) × 0.10 + $0 = $70 • PV of Bonds Without the Gamble = $200 • PV of Stocks Without the Gamble = $0 • PV of Bonds With the Gamble = $30 / 1.5 = $20 • PV of Stocks With the Gamble = $70 / 1.5 = $47
Selfish Strategy 2: Underinvestment • Consider a government-sponsored project that guarantees $350 in one period • Cost of investment is $300 (the firm only has $200 now) so the stockholders will have to supply an additional $100 to finance the project • Required return is 10% • Should we accept or reject?
Selfish Stockholders Forego Positive NPV Project • Expected CF from the government sponsored project: • To Bondholder = $300 • To Stockholder = ($350 - $300) = $50 • PV of Bonds Without the Project = $200 • PV of Stocks Without the Project = $0 • PV of Bonds With the Project = $300 / 1.1 = $272.73 • PV of Stocks with the project = $50 / 1.1 - $100 = -$54.55
Selfish Strategy 3: Milking the Property • Liquidating dividends • Suppose our firm paid out a $200 dividend to the shareholders. This leaves the firm insolvent, with nothing for the bondholders, but plenty for the former shareholders. • Such tactics often violate bond indentures. • Increase perquisites to shareholders and/or management
Can Costs of Debt Be Reduced? • Protective Covenants • Debt Consolidation: • If we minimize the number of parties, contracting costs fall.
Protective Covenants • Agreements to protect bondholders • Negative covenant: Thou shalt not: • Pay dividends beyond specified amount. • Sell more senior debt & amount of new debt is limited. • Refund existing bond issue with new bonds paying lower interest rate. • Buy another company’s bonds. • Positive covenant: Thou shall: • Use proceeds from sale of assets for other assets. • Allow redemption in event of merger or spinoff. • Maintain good condition of assets. • Provide audited financial information.
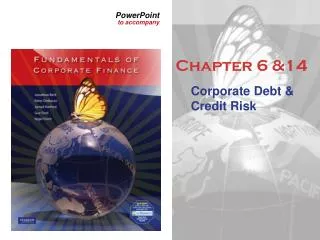
Integration of Tax Effects and Financial Distress Costs • There is a trade-off between the tax advantage of debt and the costs of financial distress. • It is difficult to express this with a precise and rigorous formula.
Integration of Tax Effects and Financial Distress Costs Value of firm underMM with corporatetaxes and debt Value of firm (V) Present value of taxshield on debt VL = VU + TCB Maximumfirm value Present value offinancial distress costs V = Actual value of firm VU = Value of firm with no debt 0 Debt (B) B* Optimal amount of debt
The Pie Model Revisited • Taxes and bankruptcy costs can be viewed as just another claim on the cash flows of the firm. • Let G and L stand for payments to the government and bankruptcy lawyers, respectively. • VT = S + B + G + L • The essence of the M&M intuition is that VT depends on the cash flow of the firm; capital structure just slices the pie. S B G L
Pie Again VT = S + B + G + L = VM + VN VM= marketed claims = debt and equity. VN= non-marketed claims = tax liabilities G plus other claimants L such as potential lawsuits or pension fund liabilities. • any change in the size of one piece of the pie must be offset by a change in the size of one or more of the other pieces. • the manager’s objective is to maximize the value of the marketed claims while minimizing the value of the non-marketed claims.
Example 1986: • Pennzoil was awarded $10.3 billion from Texaco by Texas courts because of Texaco’s interference with Pennzoil’s effort to acquire the assets of Getty Oil Co. • Texaco filed for Chapter 11 reorganization in attempt to shield the equity shareholders from this onerous non-marketed claim.
Free Cash Flow Hypothesis • An individual will work harder for a firm if he is one of the owners than if he is one of the “hired help”. • Who bears the burden of these agency costs? • While managers may have motive to partake in perquisites, they also need opportunity. Free cash flow provides this opportunity. • The free cash flow hypothesis says that an increase in dividends should benefit the stockholders by reducing the ability of managers to pursue wasteful activities. • The free cash flow hypothesis also argues that an increase in debt will reduce the ability of managers to pursue wasteful activities more effectively than dividend increases.
The Pecking-Order Theory • Theory stating that firms prefer to issue debt rather than equity if internal finance is insufficient. • Rule 1 • Use internal financing first. • Rule 2 • Issue debt next, equity last. • The pecking-order theory is at odds with the trade-off theory: • There is no target D/E ratio. • Profitable firms use less debt. • Companies like financial slack
Growth and the Debt-Equity Ratio • Growth implies significant equity financing, even in a world with low bankruptcy costs. • Thus, high-growth firms will have lower debt ratios than low-growth firms. • Growth is an essential feature of the real world; as a result, 100% debt financing is sub-optimal.
Personal Taxes: The Miller Model • The Miller Model shows that the value of a levered firm can be expressed in terms of an unlevered firm as: Where: TS = personal tax rate on equity income TB = personal tax rate on bond income TC = corporate tax rate
Personal Taxes: The Miller Model (cont.) • In the case where TB = TS, we return to M&M with only corporate tax:
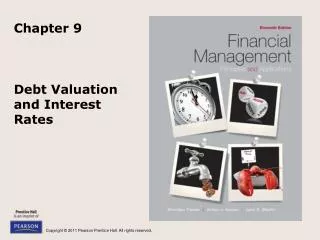
Effect of Financial Leverage on Firm Value with Both Corporate and Personal Taxes VL = VU+TCB when TS =TB Value of firm (V) VL < VU + TCBwhen TS < TB but (1-TB) > (1-TC)×(1-TS) VU VL =VU when (1-TB) = (1-TC)×(1-TS) VL < VU when (1-TB) < (1-TC)×(1-TS) Debt (B)
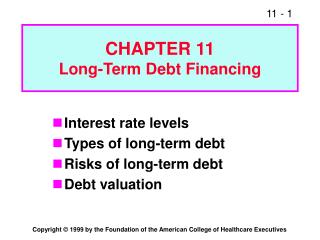
Agency Cost of Equity Agency Cost of Debt Integration of Personal and Corporate Tax Effects and Financial Distress Costs and Agency Costs Present value offinancial distress costs Value of firm underMM with corporatetaxes and debt Value of firm (V) Present value of taxshield on debt VL = VU + TCB VL < VU + TCBwhen TS < TB but (1-TB) > (1-TC)×(1-TS) Maximumfirm value VU = Value of firm with no debt V = Actual value of firm 0 Debt (B) B* Optimal amount of debt
Managerial Recommendations • The tax benefit is only important if the firm has a large tax liability • Risk of financial distress • The greater the risk of financial distress, the less debt will be optimal for the firm • The cost of financial distress varies across firms and industries and as a manager you need to understand the cost for your industry
How Firms Establish Capital Structure • Most Corporations Have Low Debt-Asset Ratios. • Changes in Financial Leverage Affect Firm Value. • Stock price increases with increases in leverage and vice-versa; this is consistent with M&M with taxes. • Another interpretation is that firms signal good news when they lever up. • There are Differences in Capital Structure Across Industries. • There is evidence that firms behave as if they had a target Debt to Equity ratio.
Observed Capital Structure • Capital structure does differ by industries • Differences according to Cost of Capital 2000 Yearbook by Ibbotson Associates, Inc. • Lowest levels of debt • Drugs with 2.75% debt • Computers with 6.91% debt • Highest levels of debt • Steel with 55.84% debt • Department stores with 50.53% debt
Work the Web Example • You can find information about a company’s capital structure relative to its industry, sector and the S&P 500 at Yahoo Marketguide • Click on the web surfer to go to the site • Choose a company and get a quote • Choose ratio comparisons
Factors in Target D/E Ratio • Taxes • If corporate tax rates are higher than bondholder tax rates, there is an advantage to debt. • Types of Assets • The costs of financial distress depend on the types of assets the firm has. • Uncertainty of Operating Income • Even without debt, firms with uncertain operating income have high probability of experiencing financial distress. • Pecking Order and Financial Slack • Theory stating that firms prefer to issue debt rather than equity if internal finance is insufficient.
Example • EXES is an all equity firm (1,000 shares) • r0 = 20% • All earnings are paid as dividends. • TC=TS=TB=0 • Expected Operating Income (EBIT) Probability EBIT 0.1 $1,000 0.4 $2,000 0.5 $4,200 E(EBIT) = .1(1,000) + .4(2,000) + .5(4,200) = $3,000
Example, continued a. What is the value of EXES Company? VU = SU = (EBIT)/r0 = $3,000/.2 = $15,000 b. The president of EXES has decided that shareholders would be better off if the company had equal proportions of debt and equity. He proposes to issue $7,500 of debt at an interest rate of 10%. He will use the proceeds to repurchase 500 shares of common stock.
Example, continued. i. What will the new value of the firm be? Since we are in a world with no taxes: VL =VU= $15,000 ii. What will the value of EXES’s debt be? B = $7,500 iii. What will the value of EXES’s equity be? SL =VL-B = $15,000-$7,500 = $7,500
Example, continued c. Suppose the president’s proposal is implemented. i. What is the required rate of return on equity? rS = r0 +(B/S)(r0-rB) = .20+(7500/7500)(.20-.10) = 0.30 = 30% ii. What is the firm’s overall required return? WACC= (7500/15000)(10%) + (7500/15000)(30%) = 20%= r0
Example, continued • Suppose the corporate tax rate is 40%. i. What is the value of the firm? VU = SU = (EBIT) (1- TC)/ r0 = $3000(1-.4)/.2 = $9,000 VL= VU +TC B =$9,000+ .40*$7,500 = $12,000
Example, continued. • Does the presence of taxes increase or decrease the value of the firm? • Taxes decrease the value of the firm because the government becomes a claimant on the firm’s assets. • How does the presence of bankruptcy costs change the effect of taxes on the value of the firm? • They will further lower the value of the firm.
Example, continued • Suppose TB=40% and TS=0. i. What is the value of EXES? = $9,000 + [1-(1-.4)(1-0)/(1-.4)]($7,500) = $9,000 • The debt no longer adds value.
Example, continued. • Under the Miller model, what will happen to the value of the firm as the tax on interest income rises? (TB=55%) VL= $9,000+[1-(1-.4)/(1-.55)]($7,500) = $6,500
Summary and Conclusions • Costs of financial distress cause firms to restrain their issuance of debt. • Direct costs • Lawyers’ and accountants’ fees • Indirect Costs • Impaired ability to conduct business • Incentives to take on risky projects • Incentives to underinvest • Incentive to milk the property • Three techniques to reduce these costs are: • Protective covenants • Repurchase of debt prior to bankruptcy • Consolidation of debt
Summary and Conclusions • Because costs of financial distress can be reduced but not eliminated, firms will not finance entirely with debt. Value of firm underMM with corporatetaxes and debt Value of firm (V) Present value of taxshield on debt VL = VU + TCB Maximumfirm value Present value offinancial distress costs V = Actual value of firm VU = Value of firm with no debt 0 Debt (B) B* Optimal amount of debt
Agency Cost of Equity Agency Cost of Debt Summary and Conclusions • If distributions to equity holders are taxed at a lower effective personal tax rate than interest, the tax advantage to debt at the corporate level is partially offset. In fact, the corporate advantage to debt is eliminated if (1-TC) × (1-TS) = (1-TB) Present value offinancial distress costs Value of firm underMM with corporatetaxes and debt Value of firm (V) Present value of taxshield on debt VL = VU + TCB VL < VU + TCB when TS < TB but (1-TB) > (1-TC)×(1-TS) Maximumfirm value VU = Value of firm with no debt V = Actual value of firm 0 Debt (B) B* Optimal amount of debt
Summary and Conclusions • Debt-to-equity ratios vary across industries. • Factors in Target D/E Ratio • Taxes • If corporate tax rates are higher than bondholder tax rates, there is an advantage to debt. • Types of Assets • The costs of financial distress depend on the types of assets the firm has. • Uncertainty of Operating Income • Even without debt, firms with uncertain operating income have high probability of experiencing financial distress.
The Bottom Line • The validity of the MM propositions depend on the nature and degree of market imperfections. • Some market imperfections are important: corporate and personal taxes, agency costs, and other costs of financial distress. • There is a target debt-to-equity range for most firms. • A safe strategy is to stay close to the industry average since these firms represent the survivors.