Download
1 / 15
150 likes | 174 Vues
Explore how visual and verbal integration, self-explanation, and diagram interaction enhance robust learning in geometry. Research problem, design, and outcomes examined.

E N D
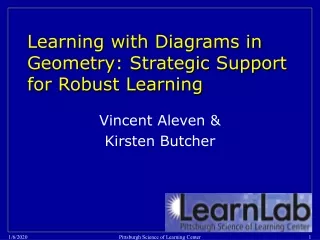
Learning with Diagrams in Geometry: Strategic Support for Robust Learning Vincent Aleven & Kirsten Butcher Pittsburgh Science of Learning Center
Placing Study within Robust Learning Framework • Primary research cluster • Interactive communication, coordinative learning, refinement & fluency • Independent variables • IC: Reflective dialog, scripting collaboration, peer tutoring, peer observation of tutoring... • CL: self-explanation, integrate conceptual & procedural, multi-representations, multi-modal, … • R&F: Feature focusing, example comparison, cognitive mastery, optimal spacing, … • Dependent variables • Normal post-test, long term retention, transfer, future learning Pittsburgh Science of Learning Center
Background • Close proximity between visual and verbal information improves learning • Simultaneous (vs. successive) presentation (Mayer & Anderson, 1992; Mayer & Sims, 1994) • Close (vs. distant) presentation (Mayer, 1989; Moreno & Mayer, 1999) • Students develop deeper understanding of instructional materials when they self-explain to themselves during learning • Student-generated comments (e.g., Chi, deLeeuw, Chiu, & LaVancher, 1994) • Menu-based explanations (Aleven & Koedinger, 2002) Pittsburgh Science of Learning Center
Research problem • Scientific Problem • Can coordination between and integration of visual and verbal information improve robust learning? • Can this integration be supported by scaffolds during tutored practice? • Application Problem • Typical problem-solving practice results in shallow learning (see next slide), poor connections between geometry principles & diagrams • Hypothesis • Interacting and self-explaining with geometry diagrams will: • Decrease use shallow problem-solving strategies • Support integration of verbal and visual knowledge Pittsburgh Science of Learning Center
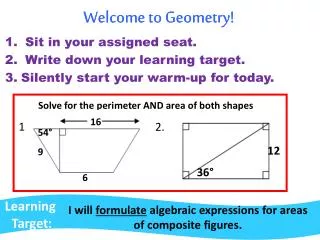
Educational Problem Shallow Strategy, Close = Connected Inscribed Angle: The measure of an inscribed angle is equal to half the measure of its intercepted arc. Shallow strategies sometimes work! An (incorrect) nearby angle can be applied to the goal angle, leading to a shallow understanding of the geometry principle. Pittsburgh Science of Learning Center
Study Design Site of Interaction During Problem Solving DIAGRAM (Contiguous) TABLE (Non-contiguous) GEOMETRY RULE (Verbal Explanation) GEOMETRY RULE (Verbal Explanation) Type of Explanation TABLE (Non-contiguous) DIAGRAM (Contiguous) GEOMETRY RULE + APPLICATION (Verbal + Visual Expl.) GEOMETRY RULE + APPLICATION (Verbal + Visual Expl.) *Time in tutor is controlled across conditions. Pittsburgh Science of Learning Center
Variable 1: Site of Interaction (Table v. Diagram) In table condition, all answers and geometry rules are entered in a separate table. Pittsburgh Science of Learning Center
Variable 1: Site of Interaction (Table v. Diagram) In diagram condition, student interacts with diagram, opening nearby work areas, with accepted answers displayed in diagram Pittsburgh Science of Learning Center
Variable 2: Type of Explanation (Rule vs. Rule + Application) Geometry Rule Only – Students justify their numerical answers with a relevant geometry rule. Pittsburgh Science of Learning Center
Variable 2: Type of Explanation (Rule vs. Rule + Application) Rule + Application – After justifying their numerical answer with a relevant geometry rule, students indicate what known diagram elements are referents of the rule Pittsburgh Science of Learning Center
Robust Learning Assessments • Immediate Posttest • Short-term Retention & Transfer • Posttest given just after instruction • Delayed Posttest • Long-Term Retention and Transfer • Given 3 weeks after instruction • Computer-based assessments using CTAT (screen shots available) • Both tests include • Isomorphic problem solving tasks (“If angle ABC = 78°, what is the measure of angle DBF?”) • Transfer: Decision-making tasks (“Is there enough information to solve this problem?”) • Transfer: Goal-free problem solving (“Derive and explain all you can”) Pittsburgh Science of Learning Center
Direct interaction with visual representations & self-explanations that connect visual & verbal info support sense-making, improving foundational skills and leading to robust learning. How our treatment fits Robust Learning Outcomes: Knowledge, reasoning & learning processes Foundational Skills Sense-Making Learning Processes: Construction, elaboration, discrimination Refinement of Features Co-Training Streng-thening Instructional Processes:(independent variables or treatments) Multiple inputs, representations, strategies…self-explanation connects vis/verbal representations Feedback, example variability, authenticity … Tutorial dialogue, peer collaboration … Schedules, part training …
Which pathways probably explain the results? Accelerated Future Learning Normal learning Long-term Retention Robust learning measures Transfer Additional reasoning duringtesting Cognitive headroom Self-supervised learning Rederiv- ation Adapt- ation KCs with valid features StrongerKCs Knowledge outcomes Meta-cognitive KCs Deep, general, flexible KCs Broad outcome categoriesof learning/instructional processes during training Sense-Making Foundational Skill Building
Micro-level interpretation Site of Interaction During Problem Solving DIAGRAM TABLE GEOMETRY RULE GEOMETRY RULE Type of Explanation DIAGRAM TABLE GEOMETRY RULE + APPLICATION GEOMETRY RULE + APPLICATION Pittsburgh Science of Learning Center
Questions? Pittsburgh Science of Learning Center