Download
1 / 29
290 likes | 472 Vues
VIABILITY. THREAT. MNGNT. Steve Schill, The Nature Conservancy George Raber, University of Southern Mississippi. Tool Objectives . Integrate IABIN’s Ecosystem and Protected Area Thematic Networks

E N D
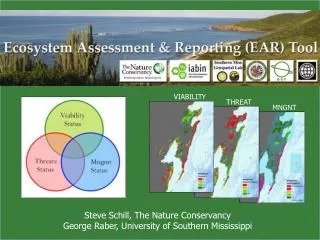
VIABILITY THREAT MNGNT Steve Schill, The Nature Conservancy George Raber, University of Southern Mississippi
Tool Objectives • Integrate IABIN’s Ecosystem and Protected Area Thematic Networks • Provide a simplistic “manager’s dashboard” approach for querying and visualization of effective conservation • Permit conservation decision-makers to cross-query ecosystems with protected area information • Spatial and tabular reporting of ecosystems and protected areas
What questions does EAR help you to answer? • What is the current protection status of each ecosystem? • How close are we to meeting conservation goals, what percentage has been achieved? • If I need additional hectares to reach my goal, where are the most suitable areas to implement a protection strategy?
What questions does EAR help you to answer? • What is secure and expected to persist? • Where are the gaps in protection and threat abatement? • Where are there opportunities to expand and enhance biodiversity protection? • What progress are we making?
A Few Facts about EAR • Available as an Desktop (ArcToolbox for ArcGIS v.9-10) or Internet version • Desktop version written in Python –reports output as html (JavaScript and CSS) • Internet version wraps the desktop tool using ArcGIS Server. Web app written with OpenLayers. • Free
Evaluating Effective Conservation Mitigate Threats Implement Mngmt Plan = Effective Conservation Implement Mngmt Plan Viability Status Mitigate Threats Improve Viability Implement Mngmt Plan Improve Viability Mitigate Threats Threats Status Mngmt Status Improve Viability (Higgins et al, 2007)
Evaluating Effective Conservation EFFECTIVE CONSERVATION (Higgins et al, 2007)
Requirements for Running EAR Tool • Ecosystems GIS Data: Attribute Fields: VIABILITY and THREAT SCORES: Very Good (VG) Good (G) Fair (F) Poor (P) • Protected/Managed Areas GIS Data: Attribute Fields: MANAGEMENT SCORES: Very Good (VG) Good (G) Fair (F) Poor (P)
Viability and Threat Models VIABILITY: Current conditions THREAT: Future conditions
Developing Future Threat Models SLR RESILIENCE
Conservation Management Status (CMS) Intent: Are management objectives intended to secure biodiversity? Duration: How long will the commitment to protection last? Effective Management Potential (EMP): Are there available resources, adequate governance, and a planning framework for the management objectives to be achieved? (Higgins et al, 2007)
Calculating CMS: INTENT Based on IUCN categories: I, II, IV = Very Good (VG) V, VI = Good (G) III = Fair (F) Non-designated = Good (G)* * based on assumption that these areas are most likely set up for a sustainable conservation focus. Biodiversity Conservation Focus Sustainable Conservation Focus Incidental Biodiversity Conservation
Calculating CMS: DURATION Permanent declared protected areas = Very Good (VG) Short term declaration = Fair (F) Non-declared protected areas = Poor (P) for no commitment.
http://www.wdpa.org/ME/ Using ME survey data for calculating EMP 40+ methods applied to 100+ countries
Calculating CMS: Effective Management Potential GOVERNANCE c PLANNING RESOURCES
Calculating CMS: Effective Management Potential “Majority rules” If at least two of the three indicators share the same rating, then the occurrence receives that rating Exceptions: • If any one indicator is rated as poor the CMS is rated poor. • If one indicator is rated very good, one good, and one fair, then CMS is rated good. • If two indicators are rated very good, and one fair, then CMS is rated good.
Habitat Assessment: Mangroves VIABILITY THREAT MNGNT
EAR Summary • Provides a GIS-based reporting framework for strategic conservation decision-making • Permits the calculation, visualization, and reporting of eight conservation action classes • Requires two input layers: Ecosystems/species and Protected/Managed areas • Operates using pre-defined viability, threat, and management scores • Flexible in that it does not require pre-determined methods for defining and ranking these scores
Support for EAR www.eartool.org Questions? sschill@tnc.org • Download tool • Sample datasets • User manual English Español http://www.ebmtools.org/ecosystem-assessment-and-reporting-tool.html