Enhanced Debugger Visualization in SharpDevelop IDE: Efficient Collection Debugging
Explore the enhanced debugger capabilities in SharpDevelop IDE, including object graph visualizer and collection visualizer for efficient debugging of collections. Overcome challenges such as memory graph analysis and achieve better performance with lazy calculations. Integrated in standard release with extensibility for new visualizers. Your solution for advanced debugging needs.


Enhanced Debugger Visualization in SharpDevelop IDE: Efficient Collection Debugging
E N D
Presentation Transcript
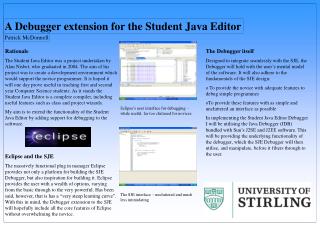
Debugger Frontent for the SharpDevelop IDE Martin Koníček
Current state of debugging • Breakpoints, watches, etc. • Basically the same in any current IDE
What about data structures? • Debugger does not provide a useful view of reality
Solution • Object graph visualizer
Debugging collections • Very common case – collections of objects
Debugging collections • Users have to expand each item to see anything
Solution • Collection visualizer
Problems faced • Determining how the graph looks in memory • The graph lives in a separate process, GC moves objects while the debugger is trying to analyze the graph • Dynamic layout and animation of the graph • Small graph changes -> small layout changes • Calculating “natural” edge routes
Problems faced • Achieving reasonable performance • Interprocess communication very expensive • Need to handle large collections • Solution: everything is as lazy as possible. What is not on the screen is not being calculated.
Results • Already integrated in the standard release of SharpDevelop • Received positive feedback • will evangelize the features to collect more feedback • Extensibility • users can plug in new visualizers
Thank you for your attention Questions?