Download
1 / 28
280 likes | 394 Vues
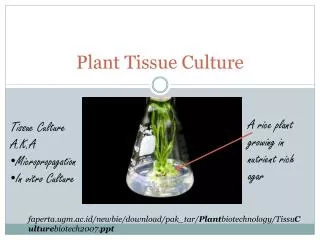
Plant and Mammalian Tissue Culture. Fluorescence Microscope Basics and Beyond - much taken from Nikon’s Microscopy U tutorial www.microscopyu.com …and Olympus Microscopy Primer www.olympusmicro.com. Genes used to measure transfection efficiency.

E N D
Plant and Mammalian Tissue Culture Fluorescence Microscope Basics and Beyond - much taken from Nikon’s Microscopy U tutorial www.microscopyu.com …and Olympus Microscopy Primer www.olympusmicro.com
Genes used to measure transfection efficiency. One of the most common is Green Fluorescent Protein Reporter Genes
GFP Easily viewed under a fluorescence microscope. Excitation Maximum at 395 nm Emission Maximum at 509 nm Green Fluorescent Protein
Use Green Fluorescent Protein to test the ability to genetically alter animal cells in culture. (Collaboration with Aldevron) • Panel A - Gwiz High Expression Vector GFP • Panel B - pGreen Lantern Expression Vector
Fluorescence • Length of time the molecule is in the high energy state is the fluorescence lifetime • Loss of energy from absorbed photon to released photon is due to molecular vibrations and heat Fluorescence is the absorbance of a high energy photon, excitation of the molecule to a high energy state with a release of energy at a lower energy in photon of a lower (red shifted) wavelength.
Fluorescence • Many fluorescent dyes contain conjugated rings with electron withdrawing nitrogen groups. Fluorescence involves shining a light (broad spectrum or focused filtered light) onto a sample and measuring the light emitted. Emitted light is measured from a side or different angle than the excited light
Fluorescence • Small Stokes Shifts result in overlap and result in difficult to measure dyes • The efficiency of excitation is the extinction coefficient – measured in quantum yield. High quantum yields is related to the intensity of given (emitted) light • Excitation and Emission for each dye is different and the spectras may overlap. The specific spectra for each dye and use of the filter sets on a microscope is critical. • Difference between max absorbance (Excitation) and Emission is called the Stokes Shift
Fluorescence • Filters (more coming on filter sets or cubes) are chemically treated to allow or block all light above a specific wavelength or a narrow slice of light through. • Knowing which filter set vs the excitation, emission, stokes shift and overlap as well as excitation coefficient is critical for success in microscopy
Fluorescence The final component in the optical train, an emission or barrier filter (white curve), transmits wavelengths in the green visible light region, in the range between 520 and 560 nanometers. Boundaries between transmitted and reflected wavelength bands of the various superimposed spectra are designed to be as steep as possible to assure nearly complete separation of the reflected and transmitted wavelengths. A pattern of sinusoidally rising and falling spikes appearing in the dichromatic mirror spectrum is a common effect of the thin-film deposition process known as ringing. The performance of this filter combination is remarkable and is a clear demonstration of the rapid advances being achieved in thin film interference filter technology. The excitation filter spectrum (red curve) exhibits a high level of transmission (approximately 75 percent) between 450 and 490 nanometers with a center wavelength (CWL) of 470 nanometers. The dichromatic mirror (yellow curve) reflects wavelengths in the region of the excitation spectrum, while passing higher and lower wavelengths with relatively high efficiency. Note that zero percent transmission on the dichromatic mirror curve corresponds to 100 percent reflection. The pronounced dip in the transmission profile between 450 and 500 nanometers, which represents a peak in reflectance, serves to reflect the band of wavelengths passing from the excitation filter at a 90-degree angle and onto the specimen.
The absorption and subsequent re-radiation of light by organic and inorganic specimens is typically the result of well-established physical phenomena described as being either fluorescence or phosphorescence. The emission of light through the fluorescence process is nearly simultaneous the absorption of the excitation light due to a relatively short time delay between photon absorption and emission ranging usually less than a microsecond in duration Fluorescence Microscopy
The basic function of a fluorescence microscope is to irradiate the specimen with a desired and specific band of wavelengths, and then to separate the much weaker emitted fluorescence from the excitation light. In a properly configured microscope, only the emission light should reach the eye or detector so that the resulting fluorescent structures are superimposed with high contrast against a very dark (or black) background. Fluorescence Microscopy
The limits of detection are generally governed by two elements: The darkness of the background The removal of excitation light. Excitation light is typically several hundred thousand to a million times brighter than the emitted fluorescence. Fluorescence Microscopy
Light of a specific wavelength (or defined band of wavelengths), often in the ultraviolet, blue or green regions of the visible spectrum, is produced by passing multispectral light from an arc-discharge lamp through a wavelength selective excitation filter. Wavelengths passed by the excitation filter reflect from the surface of a dichromatic (also termed a dichroic) mirror or beamsplitter through the microscope objective to bathe the specimen with intense light. Excitation and Emission
If the specimen fluoresces, the emission light gathered by the objective passes back through the dichromatic mirror and is subsequently filtered by a barrier (or emission) filter, which blocks the unwanted excitation wavelengths of light. Epi-fluorescence illumination is the overwhelming choice of techniques in modern microscopy Excitation and Emission
In most reflected light illuminators, the excitation filter, dichromatic mirror, and barrier filter are incorporated into an optical block (often referred to as a cube) Modern fluorescence microscopes are capable of accommodating between four and six fluorescence cubes usually on a revolving turret or through a slider mechanism Excitation and Emission
Quenching and Photobleaching • Quenching is the loss of florescence when a second molecule interacts with the flourophore and induces non-radiative relaxation from the excited state (no photon emission) • This often requires close proximity and can be used to show interaction • Photobleaching is a loss of fluorescence (fading) caused by vibrations in the excited state which change bonds – often involves reaction with O2. • Can be avoided with addition of some reagents
Applications • The wide spectrum of fluorescent proteins and derivatives uncovered thus far are quite versatile and have been successfully employed in almost every biological discipline from microbiology to systems physiology. • These unique probes have proven extremely useful as reporters for gene expression studies in both cultured cells and entire animals.
In living cells, fluorescent proteins are most commonly utilized to track the localization and dynamics of proteins, organelles, and other cellular compartments, as well as a tracer of intracellular protein trafficking. Applications
Live and dead bacteria visualized on freshly isolated human cheek epithelial cells live bacteria with intact cell membranes fluoresce green and dead bacteria with compromised membranes fluoresce red. Bacterial Contamination
Live and dead rat kangaroo (PtK2) cells stained with ethidium homodimer-1 and the esterase substrate calcein-AM Live cells fluoresce a bright green, whereas dead cells with compromised membranes fluoresce orange-red. Multicellular Eukaryotes
Bovine pulmonary artery endothelial cells LysoTracker Red - stains lysosomes red. MitoTracker Green - stains mitochondria green. Lysosomes and Mitochondria
The mitochondria of bovine pulmonary artery endothelial stained with MitoTracker Red The cells were subsequently fixed, permeabilized and stained with SYTOX Green nucleic acid stain. Mitochondria and Nucleus
Live bovine pulmonary artery endothelial cells stained with ER-Tracker Blue-White DPX Enodplasmic Reticulum
Microtubules of fixed bovine pulmonary artery endothelial cells. Alpha-Tubulin: Green F-Actin: Red Endosomes: Blue Cytoskeleton