Enhancing Algebra Skills with Graphing Calculators
Learn how to use graphing calculators effectively for Intermediate Algebra problems with an online tutorial. Benefit from step-by-step instructions and demonstrations to improve mathematical skills.

Enhancing Algebra Skills with Graphing Calculators
E N D
Presentation Transcript
An EAST Project By: Racheal Brady and Melinda Johns Instructed by: Mrs. Whitmore and Mrs. Phillips The Graphing Calculator Experience
Introduction • The purpose of our East Project is to demonstrate how to use a graphing calculator for the problems that are presented in Intermediate Algebra. • Our project will benefit the school in the way that there will be a graphing calculator demonstration online so students can use them anytime that they are needed. • We decided to have a graphing calculator demonstration after speaking to a few students and Mrs. Whitmore pointing out that there was a need for one. • The skills that we are planning to develop are using a graphing calculator, and the Camtasia Studio 5, Power Point, Microsoft Word, Microsoft Publisher and communication skills.
Project Overview Our project began by researching the kinds of problems that we were going to use for the calculator demonstration. Then we learned how to enter the problems into the calculator properly. After learning how to enter them we used the Texas Instruments Flash Debugger to enter the problems into the computer and captured a video of how to correctly work the problem.
Community Aspect • After speaking with a few students and Mrs. Whitmore pointing out that there is a need for a tutorial for a graphing calculator, we decided to make this tutorial. • It will benefit the student body in the way that will be a graphing calculator tutorial online anytime that a student will need it.
Course Content Objectives • We meet the course content objectives by providing graphing calculator tutorial for Intermediate Algebra.
Methodology Our processes included researching the kind of problems that we wanted to include in the project. Then we both learned how to enter the problems into the calculator. We used Microsoft Word to record the steps necessary to input the problems into the calculator. Then we used Camtasia Studio 5 and the TI Flash Debugger to enter the problems into the computer.
Methodology After the problems were entered into the computer we used the Camtasia Studio 5 to prepare the video for the internet. We also used Microsoft Publisher to make business cards to be handed out to the student body and a flyer that could be hung in the hallways.
Time Line • Feb. 21, 2008- Initial Presentation • March 14,2008- Information gathered for problems • April 23,2008- Problems input into the Flash Debugger • April 25, 2008- Check with fellow students for ease of use. • May 1, 2008 East Project Presentation
TEAM - Division of Labor • Melinda Johns- Interview instructors to identify common problems when trying to use graphing calculators, hand outs to make students aware of the project. • Racheal Brady-PowerPoint outline, research to come up with problems. • We will both share time inputting the problems in the computer and capturing them in the computer memory after we identify the problems that we will be using.
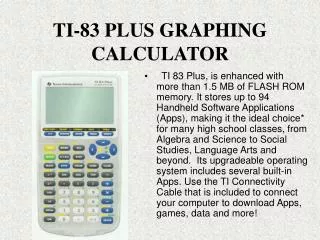
Technology to use • Graphing Calculator • Microsoft Publisher • Microsoft Office • Texas Instruments Flash Debugger • Camtasia Studio 5 to capture the steps needed when solving problems..
Community Contacts • Students at NWACC • Mrs. Whitmore’s Intermediate Algebra Class
Skills to Develop • Communication skills • Time Budgeting • Computer Software • Depending upon others in a group • Graphing calculator skills
Expected Outcome The expected outcome of our program is to have a functioning tutorial of how to use a graphing calculator.
Skills Developed • Knowledge of how to use these programs: • Microsoft Programs • Word • Power Point • Publisher • TI Flash Debugger • Camtasia Studio 5 • Communication skills
Acknowledgements • Mrs. Whitmore • Mrs. Phillips
References • Beginning & Intermediate Algebra By: Julie Miller and Molly O’Neill Published by McGraw Hill in 2006 • http://www.prenhall.comPublished
Informational Flyer Flyer that can be hung in the hallway to inform students about the graphing calculator tutorial.
Link to the Web Page • Graphing Calculator Link