- Small-Scale Impact of Activity-Based Models in Denver: A Story of Urban Transportation -
240 likes | 333 Vues
Evaluating results from Denver's activity-based model, depicting travel behavior in small geographies, guiding planners for urban transit improvements from 2010 to 2035. -

- Small-Scale Impact of Activity-Based Models in Denver: A Story of Urban Transportation -
E N D
Presentation Transcript
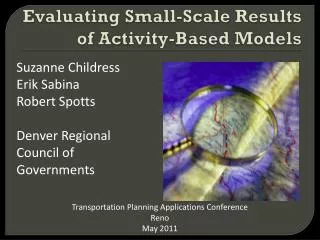
Evaluating Small-Scale Results of Activity-Based Models Suzanne Childress Erik Sabina Robert Spotts Denver Regional Council of Governments Transportation Planning Applications Conference Reno May 2011
Denver • 2010 • Pop 2.9m • Emp 1.6m • 2035 • Pop 4.5m • Emp 2.6m • Planning Goals • Urban Centers • Urban Growth Boundary • New regional light rail • Transit Oriented Development
Why small areas in Denver? Long-term planning goals 2010 to 2035 10% VMT per capita reduction 10% single occupancy vehicle mode share reduction 50% of new housing/75% of new jobs in urban centers Transportation Improvement Program (TIP) Fund Allocation -Planning Funds for Transit-Oriented Developments And Urban Centers -Bicycle-Pedestrian Project Funds
Why activity-based models Disaggregation allows for greater control and summarization (can slice and dice) More variables = more sensitivity Tracking households and people with unique characteristics
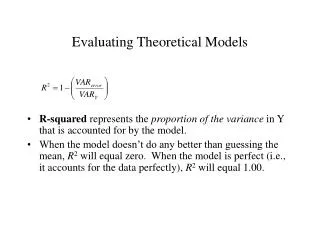
All models are wrong. Some models are useful. In what ways is Denver’s activity-based model useful at depicting travel behavior on a small geography? In what ways is it not useful?
Useful Models Tell Stories. The input variables cause outputs consistent with research and logic. Match reality in the base year (makes for a believable story) Tell a story across time, space, and types of people.
Observed Vs Modeled Trips By ModeCBD Fringe 1104 Observed Trips For Households in the Area
Observed Vs Modeled Trips By ModeWealthy Urban Shopping 832 Observed Trips For Households in the Area
Small area analysis with ABM is useful (non-fiction?). Points out areas of weakness in the model Tells a story across time, space, and types of people. Guides planners and decision-makers Observed and modeled results in the same ballpark
TIP Criteria Urban Center/TOD Evaluation Current VMT per Capita Multi-modal potential- Reduction in single occupancy vehicle percentage (2035-2010)
Bike and Pedestrian Project Evaluation User Base- Trips X-Y origins and destinations in 1.5 mile buffer Cost Effectiveness- Cost per Person Mile Traveled