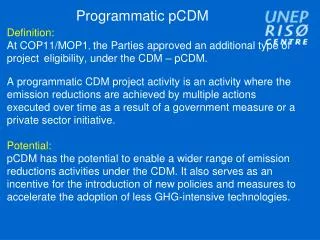
RCRAInfo Programmatic Overview
This overview highlights the importance of data entered into RCRAInfo and how it is used to track progress, shape program direction, inform regulations, and coordinate multi-facility issues. It also provides updates on key program areas and data priorities.

RCRAInfo Programmatic Overview
E N D
Presentation Transcript
RCRAInfo Programmatic Overview 2010 RCRAInfo National Users Conference
Sonya SassevilleEPA – HeadquartersOffice of Resource Conservation and Recovery
Significance of RCRA Data • Data entered into RCRAInfo by States and Regions is fundamentalto our program’s success. It allows us to: • Track and demonstrate progress • Shape future direction of program • Respond to information requests (Congress, public, OMB, etc.) • Detect program trends • Inform potential regulations, policy, and guidance • Provide a basis for Regional/State coordination on multi-facility issues (e.g., multi-facility financial assurance and bankruptcy issues) • Following is an update on our key program areas and the relevant data priorities.
Permitting: Measuring Progress • Hazardous Waste Permitting Program Goal for FY09-FY11 • Targets both initial controls (permits) and updated controls (renewals) in a combined measure • FY11 National Strategic goal • To achieve 500 approved controls in place and updated approved controls (permitting and renewal accomplishments) from FY07 – FY11 • Annual goal of 100 per year • Achieving this goal will bring 98% of facilities on the permitting baseline under approved controls and updated controls
Permitting: Using RCRAInfo to Report Progress • Reports in RCRAInfo reflect the Permitting Program and GPRA Permitting Progress. Some of the reports include: • Comprehensive Permitting Report • Missing OP020RN (Permit Renewal) Events Report • Process Unit Report • Hazardous Waste Managed Under Approved Controls Report • Hazardous Waste Progress Towards Annual GPRA Targets Report • Permitting Detailed GPRA Baseline Report • Permitting GPRA Facilities Meeting the Goal Report • Permitting GPRA Facilities Not Meeting the Goal Report • Summary of Permitting GPRA Progress Report
Permitting: Interim Status • A 2006 EPA IG Report made several recommendations in regards to Interim Status • Many of these recommendations dealt with data quality and facility details available in RCRAInfo • Nearly all of these recommendations have been implemented • The IG also recommended that we improve the oversight of new interim status units by: • Implementing a national level review to validate new interim status designations, and • Documenting the reason for interim status in RCRAInfo
Permitting: Interim Status Oversight • To follow up on the IG findings that the new interim status designations should be validated and the reasons for interim status in RCRAInfo should bedocumented, EPA • Added to RCRAInfo as part of V4 the Interim Status Verification Reports • Is defining the process to perform a data quality check • Will be asking Regions to work with their States to identify any instances where the Interim Status designation was not used properly • The following slide provides reporting tools you can use to improve your Regional/State data. • These are based on the specifications made by the IG
Permitting: Interim Status Data Quality Reports • Units that appear to have been given interim status prior to the inception of the program (November 1980) • Dates entered as pre 1980 raise a red flag about data quality (many are dated 1950 and some are not a real year "0001") • Units that are interim status now, but did not start out as interim status, according to the data • Helps identify units inappropriately identified as having interim status • In most cases, interim status units started out as interim status • All units that are now interim status • This report helps you review the units/facilities that are now coded as interim status • A number of units that have the legal status of interim status had a permit determination according to the data • In that case, the legal status needs to be updated to show that the unit is permitted
Permitting:Update on E-Permitting • Previously, EPA had initiated development of a system by which applicants for a RCRA Standardized Permit could submit application information on-line, and permit writers could use the submitted information to help generate a draft standardized permit. • However, based on low demand for this system, and considering other priorities for our resources, we have decided to discontinue this project. • If we hear from states or regions in the future that such a system is needed, we can re-evaluate, so please let us know.
Financial Assurance • The financial assurance module in RCRAInfo provides capabilities for accessing information that EPA has not had before • We have a goal of 100% data entry by the end of September 2010 • At headquarters, we have already been able to use the information that has been included without having to contact states and regions • When questions have arisen about banks that have been closed by the Office of Thrift Supervision, for example, we can determine whether these banks have issued letters of credit to hazardous waste facilities • As part of our work to develop regulations under CERCLA 108(b), we have been able to create lists of current financial assurance providers who we may talk to about these potential requirements.
Corrective Action: Measuring Progress • EPA has three GPRA measures regarding Corrective Action: • CA 725 – Human Exposures • CA 750 – Groundwater • CA 550 – Remedy Constructed • Measures are based on the 2020 Universe of 3,747 facilities • Universe updated from FY09 to FY10 (32 facilities deleted from baseline, 33 facilities added to baseline) • To better measure progress, EPA HQ is working with the States and Regions to develop a new operating facilities code • Some operating facilities have contamination that cannot be safely accessed for sampling and cleanup until the facility, or units at the facility, are shut down • This new code will allow States and Regions to indicate progress made in cleaning up these operating facilities, while indicating more work is to be done once the facility, or units at the facility, are shut down
Corrective Action: Using RCRAInfo to Report Progress • Corrective Action data entered by States and Regions is fundamentalto the program’s success. The following reports are used to track progress: • CA Comprehensive Report • CA Event Report • CA Order Data Quality Report • CA Orphan Report • CA Progress and Data Gaps Report • CA Schedule Event Trigger Report • Institutional-Engineering Controls Report • CA Environmental Indicators by Facility Report • CA GPRA Goals by Facility Report • CA GPRA Goals Report
Corrective Action: Measuring Program Efficiency • Number of final remedy components at CA facilities divided by the sum of federal, state, and private costs • It is a ratio of program results (final remedy components constructed) to inputs (program costs) • Unlike existing GPRA measures, this efficiency measure is not on a site-wide basis. It can be on a SWMU, AOC, or activity basis. • In FY09 • Based on 503 CA550 components • $40.13 million in federal CA costs • $421.50 million in private sector costs • Efficiency: 1.019 components per million dollars • Increase from 0.729 components/million in 2008
Corrective Action: Measuring Environmental Outcomes • Ready for Anticipated Use (RAUs) • RCRAInfo event code: CA800 • Included in OSWER’s Cross-Program Revitalization Measures • Reported on an OSWER level and is being considered for the Report on the Environment • This event is documented by project managers and reflects when a site is safe for anticipated reuse • We track the number of sites and number of acres • For FY09, we had acres data for all but 423 facilities (out of 3746) • 17,892,959 reported acres have been cleaned up and are ready for anticipated use. • RCRAInfo is used to compile these data and analyze by Region, type of facility (e.g., Federal Facilities), etc.
David MeredithEPA – HeadquartersOffice of Enforcement Compliance Assurance
Topics • The Big Picture: EPA’s Three New Enforcement Goals • CM&E Data and Uses in OECA • Site Remediation Enforcement Office’s (OSRE) Use of RCRAInfo Data
New EPA Enforcement Goals • Improve transparency • Reset our relationship with states: make sure we are delivering on our joint commitment to a clean and healthy environment • Aggressively go after pollution problems that make a difference in communities.
Improve Transparency • Make meaningful facility compliance information available and accessible using 21st century technologies • Hold government accountable through public information on state and federal performance • Promote better federal environmental decisions and public engagement through the National Environmental Policy Act (NEPA)
Improve Transparency (cont.) • What are the types of hazardous waste handlers regulated by EPA and the states under the RCRA Subtitle C Program? How many are there? • How can I find compliance and enforcement information about handlers regulated by the RCRA Subtitle C Program? • Can I search for a company or particular handler to see their compliance and enforcement history? • How can I find the number of inspections, violations and enforcement activity within a state? • Where can I find information about compliance and enforcement activity in a state over time? • How can I download summary information about federal and state compliance and enforcement activity?
Improve Transparency (cont.) • How can I find information about a specific compliance and enforcement activity across all states? • What options are available for reviewing the amount of waste generated by RCRA-regulated facilities? • Can I review RCRA compliance and enforcement information along with Toxics Release Inventory information? • How can I find specific information about RCRA waste generation, use, and disposal near where I live? • Where can I find information about specific state compliance and enforcement program performance? • Where can I find more information about specific enforcement cases taken by EPA under the Resource Conservation and Recovery Act?
Reset our Relationship with States • Shared accountability • Strengthened oversight • Establish new model for shared accountability and strengthened oversight, starting with water
Reset our Relationship with States (cont.) • Shared accountability • TSDF universe coverage required by statute • LQG universe coverage required by National Program Managers’ Guidance • Strengthened oversight • Consistent minimum enforcement response (timely and appropriate) to noncompliance across the states and Regions
Reset our Relationship with States (cont.) • Under the new RCRA Compliance Monitoring Strategy (CMS), data quality and completeness become more important as options are allowed for improving program performance
Aggressively go after Pollution Problems in Communities • Prevent releases of hazardous chemicals that threaten public health or the environment • Press for clean up of hazardous sites in communities: polluter pays
Aggressively go after Pollution Problems in Communities (cont.) • Complete and accurate data improves our ability to: • target to identify problems (environmental problems, repeat violators, etc.) • determine appropriate enforcement response based on facility/corporate compliance history • Support other uses (identifying compliance assistance needs, inspector training needs, etc.)
What Data is Available? • State & federal compliance assistance, compliance monitoring data and enforcement data from RCRAInfo • Federal compliance assistance information including: facility visits, responses to inquiries, targeted and general outreach conducted from OECA’s ICIS • Federal enforcement activities including: initiations, milestones, conclusions, penalties, SEPs or other environmental benefits from ICIS • Previous data sets are integrated with other EPA, federal and privately available data including: TRI data, Census demographic data and detailed satellite imagery (Google maps) in OTIS and ECHO web tools
Who Uses the Data? • EPA Headquarters and Regions • States • Congress and GAO • Inspector General • Public - via ECHO • Press • Regulated Community
How is it Used? • Program Management • Evaluation of State and EPA Performance • Case Development: Review of Facility Specific or Corporate-wide Information • Annual Enforcement and Compliance Accountability and Assessment • Enforcement Planning • Public Access to Transparent Data
Why is Data Quality Important? • If we don’t get the data right, it will tell a story that is not true • High quality data is critical to the Agency’s goal for transparency and public access to environmental information • We, at each level, are the only source for this information … There is no plan B!
RCRA Corrective Action • There are several ways we measure progress using CA data including: • Environmental Indicators (human exposure controlled and groundwater migration controlled); • acres and facilities ready for anticipated use; and • final remedy construction.
2020 Goal & NESCA • National Enforcement Strategy for Corrective Action (NESCA) • NESCA will establish consistent RCRA CA enforcement program principles, priorities, and practices. • Within the framework of NESCA are 7 common problems which need to be specifically identified and addressed separately: • Measures of Corrective Action Successes; • Streamlined Enforcement Orders; • Communication Strategies between the regulators, the regulated community and among the different regulating entities (federal and state); • The incorporation of Environmental Justice (EJ) concerns in corrective action at RCRA facilities and the use of EJ prioritization tools at such facilities; • Identification and use of tools to address financially marginal or bankrupt facilities; • Addressing corrective action at federal facilities; • The use of CERCLA authorities and tools to achieve cleanup at RCRA facilities.
RCRAInfo Financial Assurance Module • Financial assurance helps to ensure that the “polluter pays” • Why do we care about timely and accurate FA data in RCRAInfo? • It’s a “Priority!” • Current economic downturn • AIG – putting our data to work
RCRAInfo Financial Assurance Module • What are some of the critical FA data elements and why? • Type of mechanism • Mechanism issuer • Face value • Mechanism identification number (if proprietary, enter just the last four digits.)
Summary Points • EPA’s new enforcement goals increase the emphasis on data completeness and accuracy as a means to improve transparency and to enable honest evaluation of programmatic performance at both federal and state levels • RCRAInfo data use continues to expand at the national level • The enforcement arm of the RCRA corrective action program also relies on RCRAInfo data
Dwane YoungEPA – HeadquartersOffice of Resource Conservation and Recovery
First: Some Mementos • First: We need a reminder of where we don’t want to go • Second: Somebody always has to go first, and we want to recognize that bravery
Some Reflection • 2009 was a busy year: • Released RCRAInfo Version 4 • Released Financial Assurance Module • Planned and developed RCRAInfo Version 5 • Revised the Change Management Process • Performed additional QA/QC on BR Data • Revised communication procedures
Where Are We Now? • Ready to release RCRAInfo Version 5 • Supporting all translation (both XML and Flat-file) for all modules on release • New features to support Definition of Solid Waste Rule and the SubPart K (Lab) Rule • Come hear more about these and other new features at the V5 sessions • Ready for the 2009 Biennial Report • System will soon be ready for draft data submittal • Revising the QA/QC process • You’ll see many examples this conference of how people are using these data, so data quality are very important
Where Do We Go From Here? • High Quality Data • QA/QC process • Use the data • Better Public Data Access • Web Services • BR-Web • Google Earth • Focusing on the Location of data (GIS is important) • More Seamless Transition of Data from System to System • Phase out ‘Double-data-entry’ • Building the framework to support mobile devices • e-Manifest
High Quality Data • QA/QC Process • Individual staff will work with each Region to QA/QC the data • Process will be similar to the process followed this last year (however, we’re only going to do this once) • QA/QC reports are critical to this process • Use the Data • ORCR already makes extensive use of the data • As we gain more confidence in the data this will be expanded • These data provide the metrics that allow us to measure the impacts of our decisions • The data also provide the framework for good community engagement
Better Public Data Access • Web Services • Allow for better sharing of data • Build once, reuse many times • Allows for the incorporation of RCRAInfo data into any number of different applications • BR-Web • It’s time to make our data more findable (PDF documents and FTP files are no longer sufficient) • Need something that is easily maintainable (updated once the data are updated) • Google Earth/GIS • Part of making data findable is displaying the location of the data • Allows for cross-program analysis
Web Services – What Are They? STATE Internet (XML) EPA • Computer-to-computer • Uses Input parameters and outputs XML • Can be used in multiple ways by many applications
Web Services – An Example Weather Network Weatherbug is an example that many are familiar with This is all done via a Web Service Returns XML Weatherbug translates XML into information for the task bar Input Parameter: Zip Code