Download
1 / 19
190 likes | 505 Vues
Spatial Fisheries Values in the Gulf of Alaska. Matthew Berman Institute of Social and Economic Research University of Alaska Anchorage Ed Gregr Ryan Coatta Gaku Ishimura Rashid Sumaila Rowenna Flinn Andrew Trites Fisheries Centre The University of British Columbia.

E N D
Spatial Fisheries Values in the Gulf of Alaska Matthew Berman Institute of Social and Economic Research University of Alaska Anchorage Ed Gregr Ryan Coatta Gaku Ishimura Rashid Sumaila Rowenna Flinn Andrew Trites Fisheries Centre The University of British Columbia Photo ©American Seafoods Group LLC
Spatial scale of protected areas: Steller sea lion critical habitat Spatial scale of available methods Haynie and Layton (2004) Research problem: • New marine protected areas impose costly restrictions on commercial fishing. • Methods lacking to estimate costs of fishery time and area closures at scales relevant to decisions • Estimates of fisheries impacts lacking connection to ecological variables – might change over time
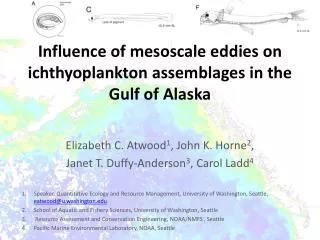
Sea surface height low high Study Objectives • Link spatial variability of fisheries catch per unit of effort (CPUE) and profitability over the season to environmental variables; • Develop methods to estimate opportunity costs to the fishing industry of habitat closures, at time and area scales relevant to management decisions. Application to Gulf of Alaska groundfish fisheries
Photo ©American Seafoods Group LLC What do we mean by costs of habitat protection? Opportunity costs, or profits foregone from time and area closures and gear restrictions
Sea surface height low high Objective 1: Link Spatial Variability of Fisheries CPUE and Values to Environmental Variables Hypothesis 1: Spatial anomalies in environmental conditions predict spatial variation in fish densities.
Measured bathymetry, water depth 600m Environmental Data:Measured Bottom Depth and Slope
Temperature at MLD Depth of Mixed Layer Salinity at Mixed Layer Depth Vertical Salinity Difference Horizontal Velocity at Mixed Layer Depth low high Environmental Data:Regional Ocean Modeling System (ROMS) Output (Hermann et al.)
Data on CPUE • NMFS trawl biomass survey data • NMFS fisheries observer data 2001 observer haul locations (green) vs. 2001 trawl survey locations (orange)
Results of Equations to Predict Spatial Variation in Fish Biomass:CPUE Data from 2001 NMFS Gulf of Alaska Bottom Trawl Survey
Pollock Sablefish Pacific Cod Average predicted CPUE, mid JuneEstimated with data from 2001 NMFS Gulf of Alaska Bottom Trawl Survey
Objective 2: Estimate Values at Scales Relevant to Management Decisions to Protect Habitat Hypothesis 2: Predicted spatial variation in fish density predicts spatial distribution of fishing effort at detailed spatial scales (3km grid).
Photo ©American Seafoods Group LLC Fisheries Values: Turning Harvest into Money • Prices of landed catch • Fishing costs • Focus on costs that vary spatially (cost of moving around the ocean) • Distance to port (shore-based fleet) • Distance between good fishing sites (offshore fleet)
Average predicted CPUE of Pacific cod > 0.5 kg within 30km of the fishing siteEstimated with data from 2001 NMFS Gulf of Alaska Bottom Trawl Survey Measuring Effects of Travel Costs for Offshore Fleet:Distance traveled between observed hauls related to spatial density of good fishing sites.
P. cod pollock Results for shore-based trawl fleetSummer-fall Pacific cod and pollock, 2001 Pacific cod: (p<.01) p=a+ 0.38*log(cpue) – 0.025*portdistance Pollock: (p<.01) p=a+ 0.24*log(cpue) – 0.027*portdistance
P. cod pollock Spatial scale (3km resolution) fine enough to be relevant to decisions about marine protected areas Summer/fall Pacific cod and pollock predicted spatial fishery values and expanded Steller sea lion rookery closure
Conclusions • Support for H1: Spatial variation in environmental conditions does predict spatial variation in fish densities in the Gulf of Alaska in summer 2001. • Support for H2: Predicted spatial variation in fish densities do predict spatial distribution of fishing effort. • Results generate information about opportunity costs to fisheries at spatial scales (3km) fine enough to be relevant to decisions about changes in habitat protection measures.
Next steps • Use NMFS observer data to predict CPUE – include winter fisheries • Extend analysis to Bering Sea • Test stability of relationships across years – annual variability, regime shifts
Acknowledgements Remote sensed data provided by NOAA and NASA Trawl survey data provided by the Alaska Fisheries Science Center Oceanographic model output provided by Dave Musgrave and Al Hermann NOAA Alaska Region, Alaska Fisheries Science Center, Steve Lewis, for fishery observer data and spatial data on regulations Funding provided by the North Pacific Universities Marine Mammal Research Consortium and the North Pacific Marine Science Foundation


![Freshwater Variability on the Gulf of Alaska Shelf [ OS42A-01 ]](https://cdn2.slideserve.com/3972677/slide1-dt.jpg)