1 / 6
60 likes | 78 Vues
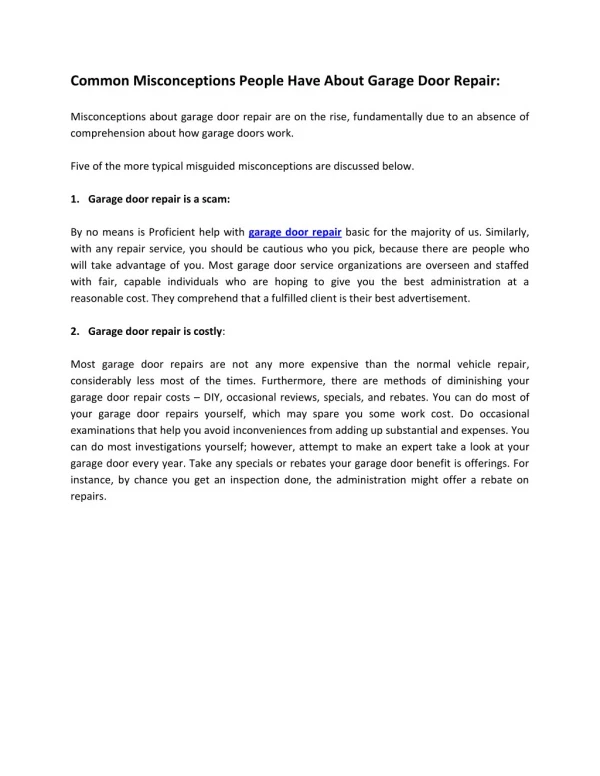
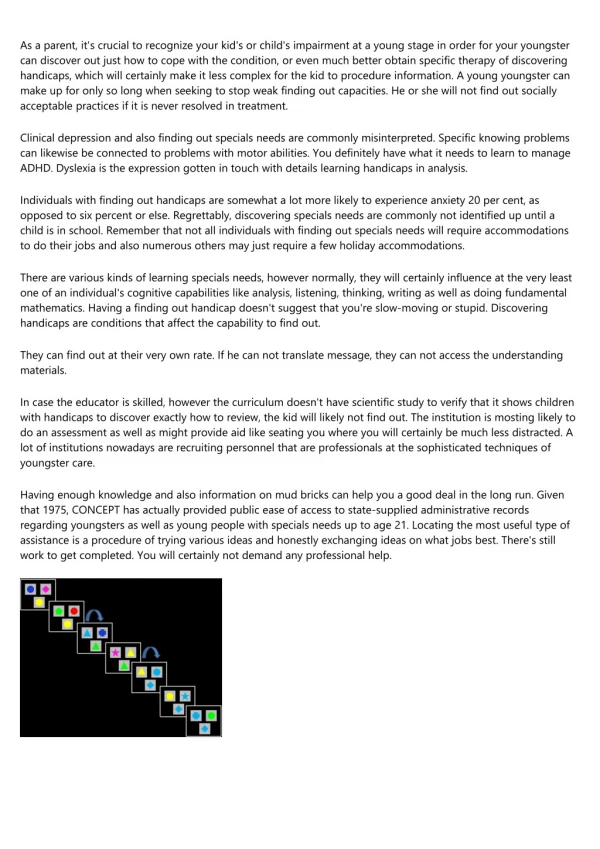
Quite often while working in the information design field, you would have been asked to make the data look cool. Agree? Itu2019s a common misconception people have about infographics that a flashy method of presenting the data is more effective than the simple one. This emphasis on the instant visual appeal of an infographic over the clarity of the presentation of data isnu2019t a good trend as it is reducing the impact infographics have on peopleu2019s mind. Read more on Read more on https://bit.ly/2WYgnCk

E N D
Common Misconceptions About Infographics People Think AreTrue Quite often while working in the information design field, you would have been asked to make the data look cool. Agree? It’s a common misconception people have about infographics that a flashy method of presenting the data is more effective than the simpleone. This emphasis on the instant visual appeal of an infographic over the clarity of the presentation of data isn’t a good trend as it is reducing the impact infographics have on people’s minds. For example, certain data presented through different representations like line, bar, and pie canbe
easily understood by people than data presented after adding some aesthetic elements. It’s because the facts that you are presenting before your readers are way more important than its visualappeal. However, if you are online and looking for the topweb design Los Angeles companyto design some amazing data-driven infographics, you must get ahold of SFWP Experts. Not only we are into web design and development but also infographics design, landing page design, and homepage design. At our company, designers believe that it is super important for businesses to have a great and beautiful-looking website as it helps in attracting users and boostingconversions. Understanding The Difference Between Data Visualization And The “Cool”Factor While presenting the data before readers our main aim should be to look for ways to effectively convey the information hidden in the depth of the content, not showcasing our design skills. Data visualization is like a means for discovery as it frees the data from the confines of its tabulated raw format and gives viewers the opportunity to see trends, gather insights, and understand the information withoutwords. On the other hand, the common infographics that you are probably viewing online these days focus more on its overall aesthetics instead of the actual statistics. That’s the cool factor for some people and they think that viewers will be interested in grasping the information thatway. The information contained posters that are heavily illustrated and have a low information-to-pixel density is dominating the infographic landscape currently. They spoon-feed the audience a set of trivial facts so that they digest the given information easily and feel themselves as a knowledgeableperson.
If you also think that your website or blogging site needs some effective infographics that present the information in a clear and understandable way, share your needs with us and we will create the exact infographics that you want. Our Los Angeles web design company has won numerous awards for providing the best services to clients across the world at fair prices. The list of services includes infographics creation, website development, search engine optimization and manymore. What’s More Important - Data OrDesign? You can’t assume this even for a moment that being informative and beautiful are mutually appealing when it comes to the infographic. There are many wonderful examples available online in which data is presented in an effective and stunning way still its beauty lies insimplicity. Often the most effective infographics and visualizations that you see online are the ones that present the data as clearly and concisely as possible. It is kept free from distractions and decorations and the emphasis is on enabling the infographic to communicate the data’s story clearly, not on making it lookcool. That means the data you publish on your page is more important than the way it is designed. The decision made during the design process will either make your viewers consume the information easily or hinder their ability to understand theinformation. A common misconception most people think is true is that the audience is interested in consuming the information only if it looks visually appealing and broken down into bite-sized chunks. But in reality, you don’t need to decorate your data to make it more interesting as the information you are revealing to your audience will itself determine the appeal of the infographic, not the fancyillustrations.
In case you want to know the costs for designing effective infographics you can have a talk with the executives of our Los Angeles web design company. First, they will ask you what type of infographic you want and then tell you the time when you can expect the delivery. Since 2011, we have been helping online businesses to achieve their goals by creating user engaging websites, simple yet good-looking infographics and high-quality content. We also specialize in SEO, PPC, and online marketing services that help in growing businesses and increasing their ROI. Why Bar Charts Are SoImportant? When you want to communicate the data effectively to large groups of people, the role of bar charts should not be underestimated. A few news organizations such as The New York Times, The Guardian, and many more use these common chart types heavily in their news, articles or posts because its simplicity and efficiency help a lot in conveying the complex information in an easyway. Knowing this, you should start using bar charts in your content from now onwards and also don’t be afraid of using them when you want to tell stories with data. This is the best practice to keep your readers engaged in your content and make them understand the actual facts and statics. But even if you want to design your data for the instant visual appeal, we would recommend you to display the given information exclusively and then carry out with the minimaldecoration. For more information about the usability of bar charts, you can approach our web design company that is based in Los Angeles. We offer a wide range of services across the globe such as responsive web design, custom web design, and eCommerce web design that includes a clear presentation of different types of data. Besides this, we arealso
well-known for providing effective online marketing solutions that encourage users to trust a brand. We show them good results that their products have brought, using different representationmethods. Conclusion Since infographics are meant to convey the specific information to viewers, it should not be designed heavily using aesthetic elements just to attract them. You should understand that infographics are included in various pieces of content just to make the complex information easy to understand for readers without the need for words. If the misconception of making infographics appealing just to attract viewers is corrected, soon its effectiveness willincrease. If there is some other misconception that you have about infographics, you must clear it out with the design experts of our Wordpress website design company. At SFWP Experts, we believe educating our customers is more important than serving them. This way our customers will be able to grow their business faster than the average time. You can choose us for as many services as you want that is related to website design, development, andoptimization. Keep in mind not everything you hear istrue. ContactDetails: 213-277-9177 la@sfwpexperts.com WordpressDeveloper
Visit Reference ProfileWebsites: https://bit.ly/2UPtnYo https://bit.ly/2JnPrnE https://bit.ly/3bBOofS https://bit.ly/2w1bn4N https://bit.ly/39u4K8P https://bit.ly/33YT6Sr https://bit.ly/33ZiE1F https://bit.ly/2UuM9oZ https://bit.ly/2UJ8iic https://bit.ly/2w4p7Mg https://bit.ly/2Jqs7FV https://bit.ly/2ULKiLi https://bit.ly/2wHCwdA