
Introduction
CB-IV. SAPRC90. CB-IV. 1-4 July 1999. SAPRC90. 2 July 1999, 12 UTC. 2 July 1999, 12 UTC. SAPRC90. 2 June 1999, 12 UTC. CB-IV: 5-7 August 1999. EVALUATION OF THE ABILITY OF INDICATOR SPECIES TO DESCRIBE THE OZONE RESPONSE TO PRECURSOR.

Introduction
E N D
Presentation Transcript
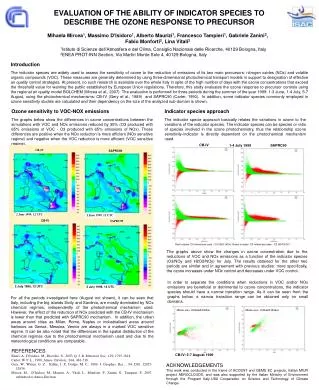
CB-IV SAPRC90 CB-IV 1-4 July 1999 SAPRC90 2 July 1999, 12 UTC 2 July 1999, 12 UTC SAPRC90 2 June 1999, 12 UTC CB-IV: 5-7 August 1999 EVALUATION OF THE ABILITY OF INDICATOR SPECIES TO DESCRIBE THE OZONE RESPONSE TO PRECURSOR Mihaela Mircea1, Massimo D'Isidoro1, Alberto Maurizi1, Francesco Tampieri1, Gabriele Zanini2, Fabio Monforti2, Lina Vitali2 1Istituto di Scienze dell’Atmosfera e del Clima, Consiglio Nazionale delle Ricerche, 40129 Bologna, Italy 2ENEA PROT-INN Section, Via Martiri Monte Sole 4, 40129 Bologna, Italy Introduction The indicator species are widely used to assess the sensitivity of ozone to the reduction of emissions of its two main precursors: nitrogen oxides (NOx) and volatile organic compounds (VOC). These measures are generally determined by using three-dimensional photochemical transport models in support to designation of effective air quality control strategies. At present, no such research is available over the whole Italy in spite of the high number of days with the ozone concentrations that exceed the threshold value for warning the public established by European Union regulations. Therefore, this study evaluates the ozone response to precursor controls using the regional air quality model BOLCHEM (Mircea et al., 2007). The evaluation is performed for three periods during the summer of the year 1999: 1-3 June, 1-4 July, 5-7 August, using the photochemical mechanisms: CB-IV (Gery et al., 1989) and SAPRC90 (Carter, 1990). In addition, some indicator species commonly employed in ozone sensitivity studies are calculated and their dependency on the size of the analyzed sub-domain is shown. Indicator species approach The indicator specie approach basically relates the variations in ozone to the variations of the indicator species. The indicator species can be species or ratio of species involved in the ozone photochemistry, thus the relationship ozone sensitivity-indicator is directly dependent on the photochemical mechanism used. Ozone sensitivity to VOC-NOX emissions The graphs below show the differences in ozone concentrations between the simulations with VOC and NOx emissions reduced by 35% (O3 produced with 65% emissions of VOC - O3 produced with 65% emissions of NOx). These differences are positive when the NOx reduction is more efficient (NOx sensitive regime) and negative when the VOC reduction is more efficient (VOC sensitive regime). CB-IV 2 June 1999, 12 UTC Red crosses: O3 references case - O3 (65% NOx); Green crosses: O3 references case - O3 (65%VOC) The graphs above show the changes in ozone concentration due to the reductions of VOC and NOx emissions as a function of the indicator species (O3/NOy and H2O2/NOy) for July. The results obtained for the other two periods are similar and in agreement with previous studies: more specifically, the ozone increases under NOx control and decreases under VOC control.. In order to separate the conditions when reductions in VOC and/or NOx emissions are beneficial or detrimental to ozone concentrations, the indicator species should have a narrow transition range. As it can be seen from the graphs below, a narrow transition range can be obtained only on small domains. For all the periods investigated here (August not shown), it can be seen that Italy, including the big islands Sicily and Sardinia, are mostly dominated by NOx chemical regimes, independently of the photochemical mechanism used. However, the effect of the reduction of NOx predicted with the CB-IV mechanism is lower than that predicted with SAPRC90 mechanism. In addition, the urban areas around cities as Milan, Rome, Naples or industrialised areas around harbours as Genoa, Messina, Venice are always in a marked VOC sensitive regime. It can be also noted that the differences in the spatial distribution of the chemical regimes due to the photochemical mechanism used and due to the meteorological conditions are comparable. Milan area: 400kmX400km Milan area: 160kmX160km REFERENCES Buzzi, A., D'Isidoro, M., Diavolio, S., 2003, Q. J. R. Meteorol. Soc., 129, 1795-1818. Carter, W. P .L., 1990, Atmos. Environ., 24A, 481-518. Gery, W., Witten, G. Z., Killus, J. P., Dodge. M. C., 1989, J. Geophys. Res., , 94, D10, 12925-12956. Mircea, M., D'Isidoro, M., Maurizi, A., Vitali, L., Monforti, F., Zanini, G., Tampieri, F., 2007, submitted to Atmos.Environ. ACKNOWLEDGEMENTS This work was conducted in the frame of ACCENTand GEMS EC projects, Italian MIUR project AEROCLOUDS, and was also supported by the Italian Ministry of Environment through the Program Italy-USA Cooperation on Science and Technology of Climate Change.


