Download
1 / 18
180 likes | 317 Vues
Parametric Study of Daylighting Strategies with Consideration of Glare Problems Case Study: IGES Research Center in Zushi. Santiago L. Torres Sakamoto Laboratory The University of Tokyo Graduate School of Engineering Department of Architecture.

E N D
Parametric Study of Daylighting Strategieswith Consideration of Glare ProblemsCase Study: IGES Research Center in Zushi Santiago L. Torres Sakamoto Laboratory The University of Tokyo Graduate School of Engineering Department of Architecture
Daylight strategies Lightshelf Blinds Tilted ceiling Louvers Reflectances: ceiling 70% walls 60% floor 40% louvers 50%
Research room: plan diagram • Sections in the main window and position of daylight sensors 5 4 5 6 7 8 3 2 1 2 3 4 1 0
Daylight strategies and factors studied • Light shelf • Louvers • Ceiling shape • Orientation Parametrical procedure • Set of simulations repeated for different instances of the building • Simulations calculated the electricity consumption for each operating hour in a year • Results are obtained from the comparison of the different simulations • Each yearly simulation took aprox. 36-40 hs. (Pentium 3, 900MHz, 500Mb of RAM, under Windows)
Models of the building Base Case Case 2 – without light shelf Case 3 – without louvers Case 4 – with horizontal ceiling S Case 5 – oriented towards south
70º 60º 40º 0º 40º 60º 70º Research room: plan diagram • Sequence in the simulation process (repeated for each hour) #?RADIANCE findglare -vp 2 5.8 1.5 -vd -1 0 0 -t 6000 -ga 10-70:10 -av .1 .1 .1 findglare.oct VIEW= -vth -vp 2 5.8 1.5 -vd -1 0 0 -vu 0 0 1 -vh 180 -vv 180 -vo 0 -va 0 -vs 0 -vl 0 FORMAT=ascii BEGIN glare source -0.999111 -0.013333 0.040000 0.146333 8758.838079 -0.751899 -0.658737 0.026714 0.052349 8017.280019 -0.784885 0.617347 0.053269 0.033143 6741.591044 -0.947418 0.000000 0.320000 0.117585 9812.825088 -0.662042 -0.649863 0.373333 0.013426 14175.594810 -0.848399 0.249883 0.466667 0.027712 13902.406172 -0.840480 -0.275346 0.466667 0.025820 14099.565250 END glare source BEGIN indirect illuminance 70 2516.027533 60 2741.833632 50 2963.398747 40 3200.358899 30 3439.329770 20 3653.850107 10 3815.299138 0 3892.450187 -10 3878.283673 -20 3776.563295 -30 3617.793440 -40 3419.675381 -50 3204.818327 -60 2989.049532 -70 2764.193109 END indirect illuminance 5 4 5 6 7 8 3 2 • Glare assessment 1 2 3 4 • Verification of glare sources 1 • Modification of blinds position 0 • Calculation of illuminance values • Calculation of electricity consumption
Diagram of the Control program Determine sky condition INPUT Climatic data skydata.out Climate.dat Sky description Building description Blinds description Sky.rad IGES.rad Blind_0 / 5.rad glare.out Rate glare incidence UGR + glare sources Modify blinds Day_hour.glr Calculate illuminance levels illum.out data.out Calculate electricity consumption OUTPUT
g#day_#hour.pic rpict p#day_#hour.pic rpict Radiance gensky • Diagram of the modules used IGES.rad blinds.rad sky.rad Determine sky condition oconv findglare.oct findglare glare#day_#hour.glr glarendx g#day_#hour.gle Rate glare incidence oconv illum.oct rillum measure.out Calculate illuminance levels
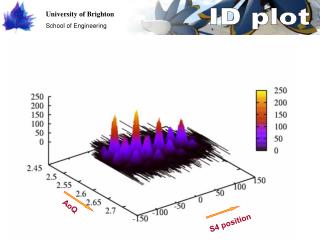
Base case Annual glare rates Daily consumption and glare incidence
Annual total energy consumption and glarevariation with respect to base case S
Known problems • The use of only one observer to assess glare conditions • The use of UGR, not specific for daylight • Low quality renderings (computing time) • Impossibility to determine the sky condition for low solar altitudes • Differences between the modeled building and the real building • All blinds in each room open or close together • Daylight sensors are placed every three or four sets of lamps • The reflectance of the louvers is much lower • Differences between simulated behavior of occupants and real occupants (unknown)
Conclusions • The variation of the glare rates was always related to a variation of the energy consumption. • The light shelf showed a protective effect without reducing the daylight levels inside the room. • The horizontal ceiling redirected the light from the light shelf further into the rear part of the room. • Changing the orientation of the main facade proved to be more effective than other measures. • Some results were counterintuitive, indicating that glare rates should be considered in energy consumption assessments. • Further research should include the comparison of this methodology with real operating conditions, especially regarding the behavior of real occupants.