Download
1 / 22
220 likes | 338 Vues
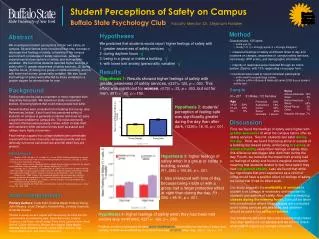
STUDENT PERCEPTIONS OF MATHEMATICS IN THE ONLINE MEDIUM. Keith Nabb Moraine Valley Community College October 2007. GENERAL CONCERNS. Failure and withdrawal rates are causing educational leaders to make difficult decisions (IHEP, 1999; Kember, 1989; MacGregor, 2002; Ryan, 2002; Weems, 2002)

E N D
STUDENT PERCEPTIONS OF MATHEMATICS IN THE ONLINE MEDIUM Keith Nabb Moraine Valley Community College October 2007
GENERAL CONCERNS • Failure and withdrawal rates are causing educational leaders to make difficult decisions(IHEP, 1999; Kember, 1989; MacGregor, 2002; Ryan, 2002; Weems, 2002) • Problems with quality control (related to challenges in defining distance education)(Keegan, 1996) • Student views are mixed(Hillstock, 2005; Li & Akins, 2005; Marland et al., 1984)
WHY PERCEPTIONS? • Online and in-class formats differ in a number of ways, one being the student role (Keegan, 1996; Holmberg, 1989) • Students may have increased responsibilities in distance education settings (Johnson et al., 1999) • The student voice, even when heard, is often ignored (Young, 2006; Tricker et al., 2001)
RESEARCH QUESTION Is there an association between students’ perceptions of mathematics taught at a distance to achievement and/or satisfaction?
INSTRUMENTS • Perception Inventory for Online Mathematics (PIOM) • Satisfaction Survey • Average across three Unit Exams
METHODS • Regression? • Limitations in Likert scale (PIOM & Satisfaction Survey) • Analysis by individual questions (interpretation is clearer and more meaningful) • Mann-Whitney U test
Two online math courses (n = 25) Calculus (n = 12) Algebra (n = 13) 68% lost from withdrawal 12% forgot their code 8% incomplete data 8% problems with self-reporting 4% not willing to reveal grades
THE “R” STUDENT • What is the definition of an “R” student? • Do these students have different perceptions of online mathematics? • Why are they taking this course? • Are these students using online courses as a framework for “familiar learning” instead of “new learning”?
I feel that this class should be easier than the same class taught in the traditional format.(n = 25)1 = Strongly Agree . . . . . . . . . . . . 5 = Strongly Disagree
I feel that online learning of mathematics is better than the traditional format.(n = 25)1 = Strongly Agree . . . . . . . . . . . . 5 = Strongly Disagree
Class 1 (Calculus) and Class 2 (Algebra) comparison on PIOM3 Mann-Whitney Test Ranks Class N Mean Rank Sum of Ranks PIOM3 1 12 9.29 111.50 2 13 16.42 213.50 Total 25 Test Statistics(b) PIOM3 Mann-Whitney U 33.500 Wilcoxon W 111.500 Z -2.492 Asymp. Sig. (2-tailed) .013 Exact Sig. [2*(1-tailed Sig.)] .014(a) a Not corrected for ties. b Grouping Variable: Class I will probably spend less time studying/learning the material in this class than I would in a traditional math class.
Mann-Whitney Test Ranks Repeat N Mean Rank Sum of Ranks PIOM1 1 15 9.73 146.00 2 10 17.90 179.00 Total 25 Test Statistics(b) PIOM1 Mann-Whitney U 26.000 Wilcoxon W 146.000 Z -2.786 Asymp. Sig. (2-tailed) .005 Exact Sig. [2*(1-tailed Sig.)] .005(a) a Not corrected for ties. b Grouping Variable: Repeat Class 1 (R students) and Class 2 (Non-R students) comparison on PIOM1 I expect the workload in this class to be lighter in comparison to math taught in the traditional format (face-to-face with a teacher).
Class 1 (R Students) and Class 2 (Non-R Students) comparison on Achievement Independent Samples Test
CONCLUSIONS/THOUGHTS • Can we build a portrait of the “successful” or “unsuccessful” online student? • Is it possible/plausible to predict online learning achievement? (Bernard et al., 2004) • Should we step away from causal/comparative studies and look within DE for the answers? • Is the distance ed audience noticeably different from the FTF audience? If so, what can practitioners do to prepare for this unique audience? • Where is the theoretical framework? (IHEP, 1999)
Self-Efficacy & Learning Styles Student Voice Student Achievement Defining DE Student Perceptions of Math taught at a distance Epistemological Beliefs Perceptions & Attitudes Dropout & Withdrawal Rates Misconceptions Quality in DE Student Satisfaction BUILDING THEORY:Topics at the crossroads of student perceptions of mathematics taught at a distance
Thanks for listening! nabb@morainevalley.edu