Download
1 / 23
230 likes | 431 Vues
Effects of climate change on the North sea coastal zone. NAG-Coast. Background An increasing knowledge on expected scenarios for sea level change , including melting of glaciers and ice caps

E N D
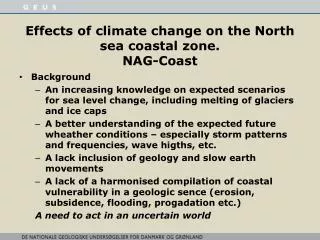
Effects of climatechangeon the North seacoastal zone.NAG-Coast • Background • An increasingknowledge on expected scenarios for sealevelchange, including melting of glaciers and icecaps • A betterunderstanding of the expected future wheatherconditions – especially storm patterns and frequencies, wavehigths, etc. • A lackinclusion of geology and slowearthmovements • A lack of a harmonisedcompilation of coastalvulnerability in a geologicsence (erosion, subsidence, flooding, progadation etc.) A need to act in an uncertainworld
The future of ice sheets and sea-level rise David Vaughan and the ice2sea Consortium
Possible future sea-level rise? Pfeffer “plausible limit” Vermeer and Rahmsdorf, 2009 Deltacommisee upper IPCC AR4 Upper Continuation of 1870-present = IPCC AR4 lower
Regional sea-level rise (Gravity component) • Relative sea-level rise in 2100 (upper bound scenario)
Local impact of the differentsources Antarctica Thermal+circulation High Mid Greenland Isostasy High Mid Glaciers High Mid Metres by 2100 Ice masses Ocean & land
Recent observed global sea-level rise 3.2 mm/year 2.0 mm/year Satellites 0.8 mm/year Tide gauges Source – Steve Nerem
Contributions the earthmovements • Tectonicuplift or subsidens • Uplift due to erosion – subsidens due to deposition • Isostaticadjustment due to loading-unloading (Ice-cover) Difficult - but may bo not impossible – seperatedifferentisostatic processes. Long time series based on coastlines is needed as the local true eustaticchangesneed to beisolatedfirst
LiDAR-technologyGlobal z-precicionsbetterthan 4-6 cm, localprecision 1 cm 1 km
The Kattegat Curve cm Calenderyear
Establishment of regional reference level • Uses tide gauges outside the localtectonic zone (ca. 1850-2009) • UseHirthals and Varberg – parallel to the isobase line • And Smøgen (Gothenburg) and Hornbæk perpendicular to isobase line • Then a plane canbedefined and then a match in the Læsø eustaticcurvecanbeobtained and adjusted • Obtained a regional eustaticcurve for 900 years
Defininglocal recent movement • Time gauge curvescannowbecompared to eachother and adjusted for the regional isotsticmovements. • Then the localisostaticmovement (to day= average for 150 years) canbedefined • The geologicalknowlegde is used in the explanation of variation • A new isostaticmap of ongoingmovementscanbeestablished
Landrise (mm/yr) determined on the basis of 26 long term tide gauges and the ASL Kattegat Curve
Map of coastaldeposits Weichseliantill Hill island Meltwaterplain
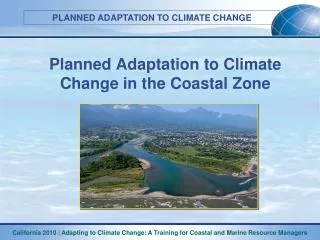
Adaption to rising sea level coastal vulnerability – coastal type
Results and problems The Kattegat curve is a coherentASL-curve of the last 900 yearsshowing a Medievalmaximumaround AD 1200, a relative Little Ice Age low-stand by ≈40 cm in the period 1250 and 1750, and cyclic Atlantic Multidecadal Oscillations by ≈10 cm with tops around 1790, 1860, 1920-50 and at the present. The ASL-curve shows a larger general SL-risethannormallyfound. However, ”the late Cenozoic isostatic system” is a normallyunconsidered land-rise due to precedingbedrock erosion of western Scandinavia as well as ≈1.5-2 km sediment-load of the central North Sea during the Plio-Pleisto-Holocene. If unrecognised, thiseffectwouldlead to underestimation of the ASL-riseduring the lateHolocene. Similar erosion/sedimentation induced isostatic effectsareactivearound the British Isles, Greenland, and the Atlantic coast of North America.