BRASIL
Discover key statistics and challenges in the Brazilian education system, highlighting investment, literacy rates, school enrollment, and higher education trends. Explore factors impacting educational quality and access in the country.

BRASIL
E N D
Presentation Transcript
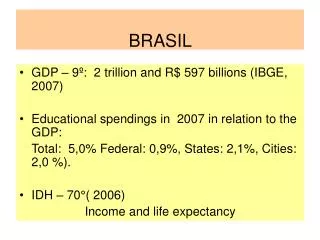
BRASIL • GDP – 9º: 2 trillion and R$ 597 billions (IBGE, 2007) • Educational spendings in 2007 in relation to the GDP: Total: 5,0% Federal: 0,9%, States: 2,1%, Cities: 2,0 %). • IDH – 70°( 2006) Income and life expectancy
Diagnose • Population: 170 millions • 65,2% up to 2 mininum wage • 11,2 % illiterate • 27,5% upt to 3 years of schooling • 60,4% have not concluded elementary school. (CONAE – IBGE, 2003)
Youth • 30% of young students (18 to 24) are studying, 71% of them are in elementary and high school. (CONAE)
DIAGNÓSTICOBRASIL • According to BBC (2007), Brazil is the country that spends less with education – 34 countries analised by OCDE (Organização para Cooperação e Desenvolvimento Econômico). • Brasil is the country that shows the smallest investiment by student (since elementary school to higher education), spending an average of US$ 1.303 per year (about R$ 2.488). • The 30 countries of OCDE spend an average of US$ 7.527 (R$ 14.376), and the country which spends more in education is Luxembourg US$ 13.458 (R$ 25.705). In Chile, US$ 2.864 (R$ 5.470) • Source:http://www.bbc.co.uk/portuguese/reporterbbc/story/2007/09/070918_educacaoocde_ba.shtml
In 2003 • Black population Elementary school: 92,7% High school: 31,9% Higher education: 4,4% Fonte: IBGE/Pnad microdados. Elaboração: Ipea/Disoc e Unifem. Fonte: http://www.planalto.gov.br/seppir/pesquisas_indicadores/genero/retrato_das_desiguladades/tabelas/2_Educacao/2.7.pdf
DATA FROM SAEB –SISTEMA NACIONAL DE AVALIAÇÃO BÁSICA 2003- MEC 59% OF CHILDREN WHO CONCLUDE THE 4TH GRAGE DON’T KNOW HOW TO READ. Fonte:http://revistaepoca.globo.com/Epoca/0,6993,EPT560854-1664,00.html http://www1.folha.uol.com.br/folha/educacao/ult305u13727.shtml
Proportion of children - 7 to 14 - attending school in 2001 Brazil and regions 7 to 14 7 to 9 10 to 14 Brazil 96,5 96,9 96,2 Norte 95,3 94,7 95,6 Nordeste 95,2 95,5 95 Sudeste 97,4 98 97 Sul 97 97,9 96,5 Centro-Oeste 97,1 97,7 96,8
Brazil • Fuctional illiteratein 2002 – 26%
Brazilians with less that 15 years of formal schooling • Sudeste 5,5% • Sul 4,6% • Centro-Oeste 4,3% • Nordeste 2,0% • Norte 1,8%
INSTRUCTION AND MONTHLY WAGE Em uma análise entre rendimentos e escolaridade, a pesquisa aponta que entre os 20% mais pobres no Brasil era de 3,9 anos. Já entre os 20% com maior renda a média era de 10,2 anos.
Average of years studied by Brazilian workers was 5,7 years (1996) • Increased to 7,2 in 2006
7% 9% 5% 6% 73%
Censo 2006 In Pernambuco – 509 Cursos
Censo 2006 • Em 2006 foram oferecidas 2.629.598 vagas. • Sendo 2.298.443(87,5%) IES Privadas e 331.105 (12,53%) IES Públicas. • Tivemos 5.181.509 candidatos para as vagas (média de 1,98). • Ingressaram 1.448.509 candidatos, ou seja, 44% das vagas ficaram ociosas. Menos de 3% das vagas ociosas são do setor público
Elitism of higher education in a public University • 60% belonged to the 20% wealthier part of the population • 3,4% belong to the 20% poorer (ibge)
Dificuldades das Instituições de Ensino na Geração do Conhecimento • Crise de identidade que a educação superior sofre em todo o mundo. • Evasão do ensino superior ( 45% abandonam o primeiro curso superior) (IBGE ) • Vagas ociosas (Apenas 69% dos universitários concluem seu curso) • Baixa quantidade de doutores entre os docentes. • Carreiras pensadas mais em função dos interesses da escola e professores que das necessidade da sociedade
Dificuldades das Instituições de Ensino na Geração do Conhecimento • Falta de equipamentos e infra-estrutura • Dificuldades de acompanhamento dos estágios • Falta de sintonia entre a academia e setor empresarial • Dificuldades de um sistema de avaliação interna e externa a IES.