Download
1 / 34
340 likes | 804 Vues
Forecasting and Valuation of Free Cash Flows. Arzac, Chapter 2. Firm Valuation. historical financial statements forecast period. opportunity costs of capital market value weight. make assumptions for continuation value use formula to get value. check different scenarios. Firm Valuation.

E N D
Forecasting and Valuation of Free Cash Flows Arzac, Chapter 2
Firm Valuation • historical financial statements • forecast period • opportunity costs of capital • market value weight • make assumptions for continuation value • use formula to get value • check different scenarios
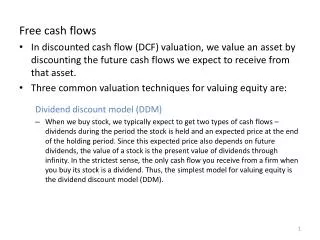
Firm Valuation • DCF valuation - incorporates estimates of FCF for set number of years with calculation of continuation value at end • multiples approach – comparable companies or comparable transactions
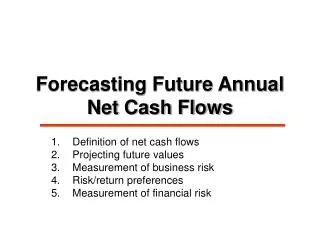
Projecting FCF • determine key performance (sales growth, profitability, and FCF generation) drivers: • internal drivers • external drivers • FCF – cash generated by firm after paying all cash operating expenses and associated taxes and funding capex and working capital but prior to payment of any interest expense • independent of capital structure – cash available to all capital providers (debt and equity holders)
Projecting FCF • historical performance • projection period length • alternative cases • projecting performance without management guidance • public companies – you can use consensus research estimates for financial statistics to get basis to begin • private companies – need to use historical performance, sector trends, and consensus estimates for similar public firms
Projecting Sales and EBITDA • source top line projections for first 2 or 3 years from consensus estimates if public or public peers if private • derive growth rate in later years from alternative sources – where???? • growth rate if no guidance • cyclical firms • sanity check • COGS and SG&A – historical COGS (gross margin) and SG&A (% of sales) • usually hold constant as % of sales in later years • EBITDA and EBIT – if we model DCF using EBITDA then we don’t need detail for COGS and SG&A • instead focus on NWC and how it changes as a % of sales
FCF Calculation • start with NI • add net interest expense after tax to get unlevered NI • (1-T)(Int. Exp. – Int. Inc.) = Unlevered NI • add back changes in deferred taxes and depreciation • noncash • ↑ def taxes is source of cash • depreciation can include all noncash charges deducted from EBIT except for goodwill
FCF Valuation • deferred taxes + unlevered NI = NOPAT • depreciation to NOPAT = Gross CF • total CF given off by firm • Gross CF – Gross Inv. = FCF (operations) • Gross Investment = • increase in NWC • + capital expenditures (funds used to purchase, improve, expand, or replace physical assets) • + investment in goodwill • + increase in net other assets
Financial Flows • includes all interest-earning or interest-paying financial securities and equity • independent estimate from FCF • must be equal to FCF (good check!)
Estimating FCF • forecast financial statements • consistency • compare with analysts ? • common forecasting error • “plugs” for building balance sheet • calculate FCF for set number of years • how long?
Estimating FCF • Continuation Value • idea is that over time most firms regress to industry norm • estimate FCFs over period of “competitive advantage” relative to industry and then make growth assumptions with firm converging to industry norm – i.e., constant growth
Estimating FCF • assumption that competition drives return on invested capital in LR to equal WACC • perpetuity model • growth rate in CF not relevant because no value creation • discount VN back to time 0 (discount using?)
Estimating FCF • value driver model • dominant firm in industry – Microsoft, Coca-Cola • potential to earn high returns on invested capital for very long time • discount to get value at T=0
Miller and Modigliani • M&M Proposition I – The market value of any firm is independent of its capital structure and is given by capitalizing its expected return at a rate appropriate to its risk class. • tax shield on debt and changes resulting • now consider bankruptcy costs
Miller and Modigliani • VL = VU + tCB where B is the market value of the bonds (B=kDD/kb) • so the value of a levered firm is equal to the value of an unlevered firm plus the PV of the tax shield from debt • in an M&M world with no taxes (tc=0), VL = VU which is prop. I (the method of financing is irrelevant)
Cost of Equity and Leverage • return on assets to firm is equal to return on a portfolio of its net debt and equity claims • beta coefficient of firm’s levered assets: βA = (D/D+E)βD + (E/D+E)βE • so βE = (1+D/E)βA – (D/E)βD* • βE = (1+D/E)βU – (D/E)βD*** • βE = (1+D/E)βU***
Other Components of Capital Structure • equity • size premium • three factor model • SMB • HML • liquidity • investment grade debt • high yield debt • convertible debt
Weighted Average Cost of Capital WACC = (rd x (1–t)) x (D/(D+E)) + re x (E/(D+E))
Problem 2.4 • GCL Industries is an industrial conglomerate undergoing restructuring. As part of its restructuring program GCL is considering the sale of its low-growth Fleet Meat Packing unit. Fleet is in the high volume-low margin meatpacking business. Fleet’s volume sales are not expected to increase in the future and the long-term growth of dollar sales is projected at 3% per year. Operating projections and other pertinent data are presented below. Estimate the price GCL may get for Fleet as of January 1, 2008.
Projections for 2.4 • Corporate tax rate: 38% • GCL estimates that the buyer can finance the acquisition with 50% debt that can be raised at 7%. • The beta of companies in Fleet’s industry with similar capital structures is 1.32. The yield on 10-year Treasury notes is 4.5%, the equity risk premium is about 4.4% and the micro-cap size premium is about 3.9%. • Valuation multiple: An examination of comparable companies yielded an average EBITDA multiple equal to 6 times current (2007) EBITDA.
Problem 2.7 • TPI Inc., a manufacturer of computer storage devices, is planning to go public at the end of 2007. The purpose of the initial public offering is to retire debt and liquefy the position of some of its original investors. Future growth will be financed by TPI’s internally generated CF and the additional borrowing made possible by the expected increase in the company debt capacity. The company has put together the following projections:
Projections for TPI • After 2012, EBIT is expected to grow at 7% per year, capital expenditures will equal depreciation and working capital will be self-financed. • Currently TPI has net debt of $112m, but its CFO has already negotiated retiring $53m with the proceeds of the equity issue and refinancing the rest at 7.86%. As a consequence, TPI is expected to begin 2008 with its net debt reduced to about $59m and its interest coverage ratio increased to about 5.99. The CFO plans to maintain the coverage ratio at that level afterwards and expects to raise future debt at an interest rate of about 8%. As far as the debt ratio is concerned, the goal is to keep it at 26% of enterprise value. The CFO believes that debt ratio would be consistent with the target coverage ratio. • TPI’s corporate tax rate is 38%. Its cost of equity is estimated accounting for risk and its relatively small size (its beta for the planned capital structure equals 2.0, Treasury yield is 4.5%, equity premium is 4.4%, and micro-cap size premium is 3.9%.) TPI has issued 10 million shares to its present owners and plans to issue 5 million new shares in the IPO, bringing the total number of shares outstanding to 15 million. • On the basis of the share prices of recent IPOs and other companies in the industry and the growth prospects of TPI, the investment bankers have suggested a preliminary IPO price based upon a P/E multiple of 13-14 times 2008 earnings. Underwriter fees are expected to be 5% of gross proceeds and additional issue expenses to amount to $600,000. • Estimate the value of TPI’s share of common equity.