Download
1 / 40
400 likes | 546 Vues
Key results from the survey on organic agriculture worldwide 2011 Part 2 : Crop and land use data. Research Institute of Organic Agriculture FiBL, Frick, Switzerland, in cooperation with the International Federation of Organic Agriculture Movements IFOAM

E N D
Key results from the survey on organic agriculture worldwide 2011Part 2: Crop and land use data Research Institute of Organic Agriculture FiBL, Frick, Switzerland, in cooperation with the International Federation of Organic Agriculture Movements IFOAM Supported by: Swiss State Secretariat of Economic Affairs, International Trade Centre, NürnbergMesse Data as published February 2011 in The World of Organic Agriculture. Statistics and Emerging Trends 2011 For updates check www.organic-world.net Contact: Helga Willer, Research Institute of Organic Agriculture, FiBL, Frick, Switzerland, helga.willer@fibl.orghttp://www.organic-world.net/presentations-2011.html
The Global Survey on Organic Agriculture: Supporters • International Trade Centre, Geneva • The Swiss State Secretariat of Economic Affairs SECO, Berne • Nürnberg Messe, the organizers of the BioFach Organic Trade Fair
The World of Organic Agriculture 2011 • The 12th editionof ‚The World ofOrganicAgriculture‘, was publishedby FiBL and IFOAM in February 2011.* • Contents: • Resultsofthesurvey on organicagricultureworldwide; • Organicagriculture in theregionsandcountryreports; • Armenia, Australia, Canada, Chile, China, Costa Rica, Indonesia, Kazakhstan, Republic of Korea, Pacific Islands, Switzerland, Tunisia, Uganda, United States and Ukraine. • Chapters on the global market, standards & legislations, voluntarystandardsandorganicbeekeeping • Numeroustablesandgraphs. • The bookcanbeordered via IFOAM.org and shop.FiBL.org. • *Willer, H, and Kilcher, L. (2011) The World ofOrganicAgriculture. Statisticsand Emerging Trends 2011. IFOAM, Bonn, and FiBL, Frick
Website www.organic-world.net • Detailed statistics in excel format (in progress) • Graphs & Maps • Data revisions • News and background information
Aboutthispresentation • This presentationssummarizesthekeyresultsofthe FiBL/IFOAM survey on organicagricultureworldwide 2011 (data 2009). In additionkeyresults on cropand on regional dataarepresented. • More informationisavailableatthepasswordareaof www.organic-world.net • The presentationshas 4 mainchapters: • Data backgroundandkeydata on organicagriculture: Land, producers, marketdata 2009 • Organicagriculture in developing countries 2009 • Land useandkeycrops in organicagriculture 2009 • Organicagriculture in theregions
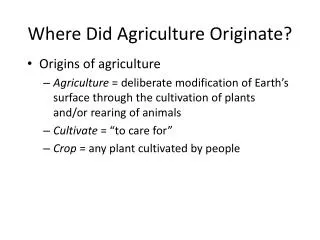
Definition of organic areas • Agricultural land (37.2 million hectares in 2009) • Cropland • Arable land (cereals, vegetables etc.) • Permanent crops (fruit, grapes, olives …) • Cropland, no details (=arable land and permanent crops) • Permanent grassland • Other agricultural land • Non-agricultural areas (41.9 million hectares) • Wild collection/Bee keeping • Forest • Aquaculture • Grazing areas on non-agricultural land
World: Use of organic agricultural land 2009 (total: 37.2 million hectares) Source: FiBL & IFOAM Survey 2011
Main land use types in organic agriculture 2009 • The chart of the share of land use types in the geographical regions shows: • For a large part of the organic agricultural land in both Africa and Asia, land use information is not available. In addition, for Asia (mainly China) no details on the uses of the cropped land are available. • Africa has a large proportion of permanent crops; these are mainly cash crops such as coffee, tropical fruit and olives. • Europe and North America use about half of their organic agricultural land as grassland, and the other half is arable land. In Europe the share of permanent crops is higher than in North America, mainly due to olives and vines grown in the Mediterranean countries. • Latin America has little arable land compared to the large grazing areas (Uruguay and Argentina). It has a comparatively high share of permanent crops (mainly coffee). • Oceania is characterized by the large grazing areas of Australia. The Pacific Islands produce a large range of tropical crops; New Zealand produces a lot of fruit.
Agricultural land use by geographical region in organic agriculture 2009 Source: FiBL & IFOAM Survey 2011
World: Use of organic agricultural land 2009 (total: 37.2 million hectares) Source: FiBL & IFOAM Survey 2011
Land use types in organic agriculture: 2008 and 2009 compared + 3 % + 13 % + 24 % FiBL/IFOAM Survey 2011
Key crop groups in organic agriculture: 2008 and 2009 compared FiBL/IFOAM Survey 2011, based on data from governments, the private organic sector and certifiers
Organic grassland/grazing areas 2009 • With a total of at least 23 million hectares, the organic grassland/grazing areas constitute almost two thirds or 61.7 percent of the organic agricultural land. • The organic grassland/grazing areas account for 0.4 percent of the world’s total organic grassland/grazing areas . • An increase of 0.7 million hectares or 3.2 percent was reported compared with 2008. • Half of the organic organic grassland/grazing areas is located in Oceania (51.1 percent of the organic grassalnd/grazing area or 11.8 million hectares), followed by Latin America (23 percentor 5.3 millionhectares) and Europe 18 percentor 4.2 millionhectares). Source: FiBL & IFOAM Survey 2011
Organic permanent grassland/grazingareasbygeographicalregion 2009 (total 23 millionhectares) Source: FiBL & IFOAM Survey 2011
Organic arable land 2009 • With a total of at least 5.5 million hectares, arable land constitutes 15 percent of the organic agricultural land. • The organic arable land accounts for 0.4 percent of the world’s total arable land. • An increase of 13.2 percent was reported. • Most of the organic arable land is located in Europe (3.7 million hectares), followed by North America (more than 1.3 million) and Latin America (170’000 hectares). • Most of this category of land is used for cereals including rice (2.5 million hectares), followed by green fodder from arable land (1.8 million hectares) and vegetables (0.22 million hectares). Source: FiBL & IFOAM Survey 2011
Organic arable land by geographical region 2009 (total 5.5 million hectares) Source: FiBL & IFOAM Survey 2011
Organic arable land worldwide by main crop types 2009 (total 5.5 million hectares) Source: FiBL & IFOAM Survey 2011
Permanent cropland 2009 • Permanent crops account for approximately six percent of the organic agricultural land, amounting to 2.4 million hectares, which is 1.7 percent of the world’s permanent cropland. • Compared with the previous survey (data 2008), almost half a million hectares more were reported. • With 6.5 percent, permanent cropland has a higher share in organic agriculture than in total agriculture, where it accounts for approximately three percent of the agricultural land. • Most of the permanent cropland is in Europe (1 million hectares), followed by Latin America (0.75 million hectares) and Africa (0.45 million hectares). • The most important crops are coffee (with 0.54 million hectares reported, constituting one-fifth of the organic permanent cropland), followed by olives (0.49 millionhectares), cocoa (0.26 millionhectares), nuts (0.2 million hectares), and grapes (0.19 millionhectares). Source: FiBL & IFOAM Survey 2011
Organic permanent cropland by geographical region 2009 (total 2.4 million hectares) Source: FiBL & IFOAM Survey 2011
Organic permanent cropland worldwide by main crop groups 2009 (total 2.4 million hectares) Source: FiBL & IFOAM Survey 2011
Organic citrus fruit 2009 • The area of organic citrus fruits includes oranges, lemons and limes, grapefruit and pomelos and ‘other citrus fruits’. • At least 65’00 hectares of citrus fruit are grown organically worldwide. • This constitutes 0.7 percent of the world’s citrus area of 8.7 million hectares (FAOSTAT, data 2008). • The countries with the largest organic citrus areas are: Italy, South Africa and Mexico. • As no crop details were available for some of the world’s leading citrus producers - China, Brazil, Nigeria and India, in that order of importance - it can be assumed that the world figures for areas under organic citrus are higher.
Organic citrus area: The ten countries with the largest areas 2009 FiBL/IFOAM Survey 2011, based on national sources
Organic citrus fruit: Growth of the organically managed land 2004-2009 Source: FiBL, IFOAM & SOEL Surveys 2006-2012
Organic cereals 2009 • In 2009, 2.4 million hectares of cereals were under organic management. • This is an increase of 0.2 million hectares compared with 2008, when 2.2 million hectares were grown organically. • The countries with the largest organic cereal areas are the US, Italy and Canada. • As some of the world’s large cereal producers (such as India, China and the Russian Federation) did not provide land use details, it can be assumed that the area is actually larger. • 0.3 percent of the total cereal area is under organic management (according to FAO 709 million hectares of cereals were harvested in 2008). • Some countries are, however, reaching higher shares: Austria (8 percent), Portugal (7.3 percent), Sweden (7.3 percent), Lithuania (6.4 percent) or Italy 6.2 percent.
Organic cereals: The ten countries with the largest areas 2009 FiBL/IFOAM Survey 2011, based on national sources
Organic cocoa 2009 • At least 265'000 hectares of organic cocoa were grown organically in 2009. • The countries with the largest cocoa area are Sierra Leone, Mexico and Ecuador. • Compared with 2008, there was an increase of 90'000 hectares. Most of the growth took place in Sierra Leone, where 50'000 hectares more were reported. • 3.1 percent of the world’s harvested cocoa bean area of 8.7 million hectares are organic. (FAOSTAT, 2008 data). • The world’s leading coca producers are Ivory Coast, Ghana, Nigeria, Indonesia and Brazil, but data on the organic cocoa area were not available for all these countries.
Organic cocoa area: The ten leading countries 2009 FiBL/IFOAM Survey 2011 based on national sources
Organic coffee 2009 • At least 0.545 million hectares of coffee were grown organically in 2009. • This constitutes 4.6 percent of the world’s harvested coffee area of 9.7 million hectares (FAOSTAT, data 2008). • The largest organic coffee areas are in Mexico, Ethiopia and Peru. • These countries are also reaching high shares of the total harvested coffee area: Ethiopia: 26.6 percent; Mexico 24.5 percent, Peru: 23.5 percent. • Compared with 2008, the organic coffee area grew by 80'000 hectares. • Data on the organic area were not available for all major coffee-producing countries (the leading producers are Brazil, Indonesia, Mexico, Colombia and Viet Nam).
Organic coffee area 2009: The ten countries with the largest areas FiBL/IFOAM Survey 2011, based on national data
Organic grape area 2009 • More than 190’000 hectares of organic grapes* were grown in 2009. • The main countries in which grapes are grown are the countries of the Mediterranean, with Spain being the largest grower, followed by Italy and France. • More than three quarters of the organic grape area are in Europe. • This is approximately 2.6 percent of the world’s total harvested grape area (7.4 million hectares, FAOSTAT 2008 data). • The highest percentage for organic grapes is in Greece and Italy (both 6.3 percent), followed by Austria 5.3 percent). • The organic grape area grew by 26 percent in 2009 and by almost 200 percent between 2000 and 2009. * Including in-conversion areas
Organic grapes: Regional distributionoftheorganicarea 2009 Source: FiBL and IFOAM Survey 2011
Organic grapes: Distribution of the organic area by country 2009 Source: FiBL and IFOAM Survey 2011
Organic grapes: The ten countries withthelargestareas 2009 FiBL/IFOAM Survey 2011, based on national sources
Organicgrapes: The ten countries/areaswiththehighestshares2009 Source: FiBL and IFOAM Survey 2011, based on national data; sharescalculatedwith FAOSTAT data
Development of the organic grape area worldwide 2000-2009 (including in-conversion areas) Source: FiBL 2000-2011
Development of the organic grape area 2000-2009 in Spain (including in-conversion areas) Source: MARA 1999-2010
Development of the organic grape area 2000-2009 in Ìtaly (including in-conversion areas) Source: SINAB 2000-2011
Development of the organic grape area 2000-2009 in France (including in-conversion areas) Source: Agence Bio 2000-2011
Organic olives 2009 • Almost 490’000 hectares of organic olives were grown in 2009. • This is approximately 4.7 percent of the world’s total harvested olive area (10.6 million hectares, FAOSTAT data from 2008). • The main countries in which olives are grown are the countries of the Mediterranean, Italy, Spain and Tunisia. • The highest percentage for organic olives is in Uruguay (28.3 percent), followed by Italy (11.8 percent), and France (9.5 percent). • Compared with 2008, the organic olive area grew by 60'000 hectares or 14 percent.
Organic olive area 2009: The ten leading countries FiBL/IFOAM Survey 2011 based on national data