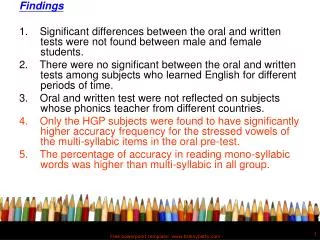
Findings
130 likes | 162 Vues
Discover how to think critically about assessment findings, inspire action, and improve programs/services based on results. Learn effective ways to present data and ensure transparency.

Findings
E N D
Presentation Transcript
Findings Office of Assessment and Planning for SEES November 2018
Overview • Thinking About Your Findings • Inspiring Action • Implementation Fidelity • Presenting Your Data • Ensuring Transparency
Thinking About Your Findings Now that you have administered your measures, collected your data and analyzed it, it is time to look at your findings… Compare your findings to what you expected, if the outcome of your analysis is different, what does that mean?
Think Critically It is important to review your results critically because this is the information that will dictate what changes you will make to your program or services! Ask yourself some questions: • “Did my unit meet its goal(s)?” • “How will I present my findings to stakeholders?” • “Are my results accurate and transparent?” • “How can I improve my programming/services?”
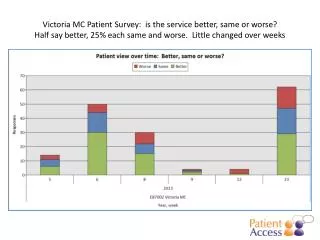
Your Results Should Inspire Action! • Tell your stakeholders the story behind your assessment, how you conducted it, what you found and how you plan to improve. • The core goal of assessment is to find ways to improve student learning. • Use your results to increase efficiency and effectivenessandoverall student learning.
Did My Unit Meet Our Goal(s)? Whether your results are positive, negative, or inconclusive your analysis and results should provide insight on what is driving these outcomes. • Positiveresults:You can work towards expanding that program or service. Always continue to monitor quality and look for minor tweaks to improve. • Negative results:Take a look at your programming/services. What improvements need to be made to boost student learning to the desired level? Enhanced training? More resources? More direct focus? • Inconclusive Results You may need to narrow the scope of your program (or instrument!) OR something may have gone wrong during the data collection process or administration of programming/services. If your analysis did not meet your expected goals, what does that mean for your program?
Did My Unit Meet Our Goal(s)? If the results are not what were expected or your unit did not meet its goals, reflect on these items: • Was the program/service implemented with high quality? • Was the theory in-line with the intervention? • Were the measures in-line with the intervention? • Was the program long enough? • Were the measures and efforts appropriate?
Implementation Fidelity (IF) All of the previously mentioned points are a part of the larger practice of implementation fidelity or the measure of the degree to which an intervention or program is delivered as intended
Blank slides allow for flexibility… Don’t Do
Are my Results Transparent?“If you torture the data long enough, it will confess to anything” – Ronald Coase When you hide or skew information it can mislead decisions and result in losses! Do everything in your power to ensure that what you are presenting is truthful and transparent!
How Can I Improve My Services? Pay attention to your findings – the data you have collected should tell you what your program is doing well and what it could improve upon. Program improvement is a continuous effort, but there is a cycle to follow.
References Atkinson, G. (2015). Five tips on presenting to stakeholders. Retrieved from https://www.stakeholdermap.com/five-tips-on-presenting-to-stakeholders.html George Washington University. (2018). Reviewing Assessment Findings. Retrieved from https://assessment.gwu.edu/reviewing-assessment-findings James Madison University. (2018). Reporting & Use of Results. Retrieved from https://www.jmu.edu/assessment/sass/step 7 use of results.shtml Kaushik, A. (2017). 7 Data Presentation Tips: Think, Focus, Simplify, Calibrate, Visualize. Retrieved from https://www.kaushik.net/avinash/data-presentation-tips-focus-think-simplify-visualize/ Kiss, M. (2018). 10 Tips for Presenting Data. Retrieved from https://www.observepoint.com/blog/10-tips-for-presenting-data/ Mistry. D. (2012). Make your Findings Effective: Choosing the Right Method to Present Research. Retrieved from https://www.uxbooth.com/articles/make-your-findings-effective-choosing-the-right-method-to-present-research/ Monash University. (2018). Reporting and discussing your findings. Retrieved from https://www.monash.edu/rlo/graduate-research-writing/write-the-thesis/writing-the-thesis-chapters/reporting-and-discussing-your-findings University of Leicester. (2018). Presenting Numerical Data. Retrieved from https://www2.le.ac.uk/offices/ld/resources/numerical-data/numerical-data