
Uploaded by
millie
4 SLIDES
142 VUES
40LIKES
Research for a reason.
DESCRIPTION
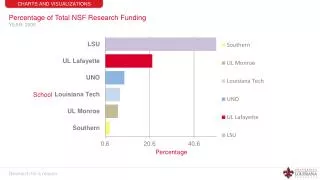
Explore the percentage distribution of NSF research funding among universities in 2008. Some universities are not listed due to minimal funding.
Download
1 / 4
Download Presentation

Télécharger la présentation
Research for a reason.
An Image/Link below is provided (as is) to download presentation
Download Policy: Content on the Website is provided to you AS IS for your information and personal use and may not be sold / licensed / shared on other websites without getting consent from its author.
Content is provided to you AS IS for your information and personal use only.
Download presentation by click this link.
While downloading, if for some reason you are not able to download a presentation, the publisher may have deleted the file from their server.
During download, if you can't get a presentation, the file might be deleted by the publisher.
E N D
Presentation Transcript
CHARTS AND VISUALIZATIONS Percentage of Total NSF Research Funding YEAR: 2008 Research for a reason.
CHARTS AND VISUALIZATIONS Incoming Freshman Average ACT Scores UL Lafayette 1999-2009 Research for a reason.
CHARTS AND VISUALIZATIONS Incoming Freshman Average ACT Scores UL Lafayette & State 1997-2008 Research for a reason.
CHARTS AND VISUALIZATIONS Percentage of Total NSF Research Funding 2008 (Universities not listed each have less than 1% of total NSF funding) Research for a reason.


More Related
Audio
Live Player