The Sun: Structure, Composition, and Magnetic Cycle
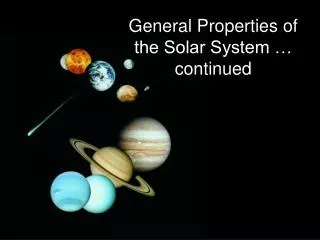
This overview delves into the Sun's fundamental properties, including its G2V spectral type, age of approximately 4.52 billion years, and internal structure characterized by nuclear fusion at its core. The Sun's atmospheric layers—the photosphere, chromosphere, and corona—are explored alongside solar phenomena like sunspots, prominences, and the solar cycle. Key aspects include energy transport mechanisms (convection and radiation), magnetic field dynamics, and the historical Maunder Minimum period. Understanding the Sun’s intricate behavior is essential for comprehending solar effects on Earth.

The Sun: Structure, Composition, and Magnetic Cycle
E N D
Presentation Transcript
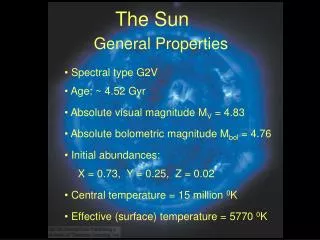
The Sun 0 General Properties • Spectral type G2V • Age: ~ 4.52 Gyr • Absolute visual magnitude MV = 4.83 • Absolute bolometric magnitude Mbol = 4.76 • Initial abundances: X = 0.73, Y = 0.25, Z = 0.02 • Central temperature = 15 million 0K • Effective (surface) temperature = 5770 0K
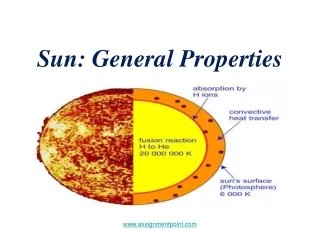
0 The Sun’s Interior Structure Photosphere Energy transport via convection Flow of energy Energy transport via radiation Energy generation via nuclear fusion Temp, density and pressure decr. outward
0 Interior Structure of the Sun Site of main energy production dL/dr 0.1 0.2 0.3 0.4 0.5 r/R0
0 Interior Structure of the Sun Mass composition 11H 0.8 Mass fraction 0.7 0.6 0.5 0.4 42He 0.3 0.2 0.1 32He (x100) 0.1 0.2 0.3 0.4 0.5 0.6 r/R0
0 The Sun’s Atmosphere Only visible during solar eclipses Apparent surface of the sun Heat Flow Temp. incr. inward Solar interior
0 Granulation … is the visible consequence of convection
Sun Spots (II) 0 Active Regions Visible Ultraviolet Cooler regionsof the photosphere (T ≈ 4000 K).
0 Solar Activity, seen in soft X-rays
0 Magnetic Fields in Sun Spots Magnetic fields on the photosphere can be measured through the Zeeman effect → Sun Spots are related to magnetic activity on the photosphere
0 Sun Spots (III) Magnetic North Poles Magnetic South Poles Related to magnetic activity. Magnetic field in sun spots is about 1000 times stronger than average. In sun spots, magnetic field lines emerge out of the photosphere.
0 Magnetic Loops Magnetic field lines Mass ejection from the sun often follow magnetic field loops.
0 The Solar Cycle 11-year cycle Reversal of magnetic polarity After 11 years, North/South order of leading/trailing sun spots is reversed => Total solar cycle = 22 years
0 The Sun’s Magnetic Cycle After 11 years, the magnetic field pattern becomes so complex that the field structure is re-arranged. → New magnetic field structure is similar to the original one, but reversed! → New 11-year cycle starts with reversed magnetic-field orientation
0 The Solar Cycle (II) Maunder Butterfly Diagram Sun spot cycle starts out with spots at higher latitudes on the sun Evolve to lower latitudes (towards the equator) throughout the cycle.
0 The Maunder Minimum The sun spot number also fluctuates on much longer time scales: Historical data indicate a very quiet phase of the sun, ~ 1650 – 1700: The Maunder Minimum
0 Prominences Looped Prominences: gas ejected from the sun’s photosphere, flowing along magnetic loops
0 Eruptive Prominences Extreme events, called coronal mass ejections (CMEs)and solar flares, can significantly influence Earth’s magnetic field structure and cause northern lights (aurora borealis). (Ultraviolet images)
0 Eruptive Prominences (Ultraviolet images)
0 ~ 5 minutes Solar Aurora Sound waves produced by a solar flare Coronal mass ejections
0 The Chromosphere Region of sun’s atmosphere just above the photosphere. Chromospheric structures visible in Ha emission Absorption and emission lines from singly ionized metals (He II, Fe II, Si II, Cr II, Ca II) T: 4400 K → 25,000 K n: 1011 cm-3 → 107 cm-3
0 The Chromosphere (II) Spicules = filaments of hot gas, visible in Ha emission. Streams extend up to ~ 10,000 km above photosphere
0 The Transition Zone Transition from moderate to high ionization h ~ 2300 – 2600 km above photosphere T ~ 25,000 → 106 K n ~ 107→ 105 cm-3 Observe selective heights in (UV) emission lines of ionized metals Ly a→ ~ 20,000 K O VI 1032 → ~ 300,000 K CIII 977 → ~ 90,000 K Mg X 625 → ~ 1,400,000 K
The Solar Corona 0 Very hot (T ≥ 106 K), low-density (n ≤ 105 cm-3) gas
0 Active vs. Quiescent Corona Near Solar Maximum Near Solar Minimum
0 Coronal Holes X-ray images of the sun reveal coronal holes. These arise at the foot points of open field lines and are the origin of the solar wind.