Download
1 / 13
130 likes | 312 Vues
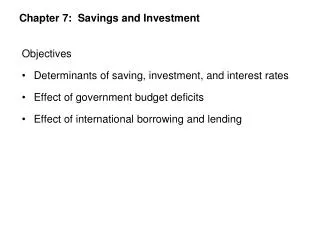
Chapter 10. Savings and Investment. Link to syllabus. The discussion about the Financial System (pp. 291-304) might have been a bit shorter, but it is very important material in today’s world . Savings-Investment Identity (p. 277). Ignore government and foreign trade:

E N D
Chapter 10. Savings and Investment Link to syllabus The discussion about the Financial System (pp. 291-304) might have been a bit shorter, but it is very important material in today’s world.
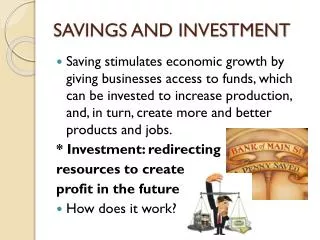
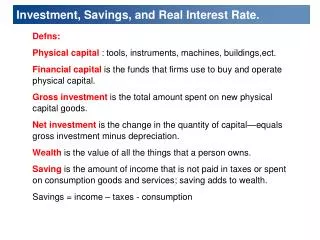
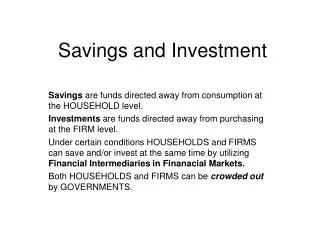
Savings-Investment Identity (p. 277) Ignore government and foreign trade: Income = Consumption + Savings Expenditures = Consumption + Investment So, Savings=investment Key Keynesian insight: savers and investors are different economic people, and are affected by different economic factors. e.g. Consumption/saving affected by income, future plans, interest rates. Business investment affected by profitability. With gov’t and trade, Investment = Savingspersonal + (Taxes-Gov. Spend) + capital inflows.
Savings-Investment Identity: US and Japan Fig.10-1, p.279 Shows how capital inflows (or outflows) combine with private savings to finance domestic investment. Year is 2007 – pre-crisis.
Global Data: Savings Rates, 2007. p. 280 U.S. has relatively low savings rates.
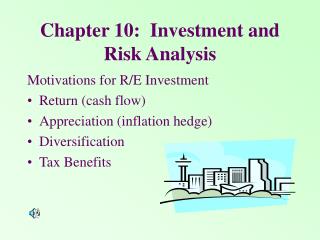
The Demand for Loanable Funds. Fig 10-2, p. 281 Depends on: Opportunities for business investments Financing of government deficits
The Supply of Loanable Funds. Fig 10-3 p. 283 Depends on: Individuals’ savings habits International loans
An Increase in the Demand for Loanable Funds. Fig. 10-5 p. 286. Standard example; increased government deficit, financed internally
An Increase in the Supply of Loanable Funds. Fig 10-6 p. 287 Example: people decide to save more, consume less.
The Fisher Effect. Figure 10-7 p. 289. (How a change in expected inflation increases the nominal interest rate).
Irving Fisher. 1867-1947 Irving Fisher was one of the earliest American neo-classical c economists, of unusual mathematical sophistication. ( 1) his contributions to the Walrasian theory of equilibrium price (he also invented the indifference curve device) in 1892; 2) His volumes on the theory of capital and I investment (1896, 1898, 1906, 1907, 1930) which brought the Austrian intertemporal theories into the English- speakin speaking world, wherein he introduced the famous distinction between "stocks" and flows", the Fisher Separation Theorem and the loanable funds theory of interest rates. 3) his famous resurrection of the quantity theory of money (1911, 1932, 1935); (4) the theory of index numbers (1922); This Yale economist was an eccentric and colorful figure. When Irving Fisher wrote his 1892 dissertation, he constructed a remarkable machine equipped with pumps, wheels, levers and pipes in order to illustrate his price theory. Socially, he was an avid advocate of eugenics and health food diets. He made a fortune with his visible index card system - known today as the rolodex - and advocated the establishment of an 100% reserve requirement banking system His fortune was lost and his reputation was severely marred by the 1929 Wall Street Crash, when just days before the crash, he was reassuring investors that stock prices were not overinflated but, rather, had achieved a new, permanent plateau.
Changes in US Interest Rates, Figure 10-8 p. 290 Illustrates that sometimes interest rates are increased by expected inflation, and other times other factors dominate.