Download
1 / 32
320 likes | 436 Vues
THE COMMONWEALTH FUND. The Commonwealth Fund 2006 International Health Policy Survey of Primary Care Physicians in Seven Countries. The Commonwealth Fund 2006 International Symposium on Health Care Policy Washington, D.C., November 1–3, 2006 Cathy Schoen, Senior Vice President

E N D
THE COMMONWEALTH FUND The Commonwealth Fund2006 International Health Policy Survey ofPrimary Care Physicians in Seven Countries The Commonwealth Fund 2006 International Symposium on Health Care Policy Washington, D.C., November 1–3, 2006 Cathy Schoen, Senior Vice President Robin Osborn, Vice President and Director, International Program in Health Policy and Practice
2006 International Health Policy Survey • Mail and telephone survey of primary care physicians in Australia, Canada, Germany, the Netherlands, New Zealand, the United Kingdom, and the United States. • Final samples: 1003 Australia, 578 Canada, 1,006 Germany,931 the Netherlands, 503 New Zealand, 1,063 United Kingdom, and 1,004 United States. • Conducted by Harris Interactive and subcontractors, and in the Netherlands by The Center for Quality of Care Research (WOK), Radboud University Nijmegen, from February 2006 to July 2006. • Cofunding from The Australian Primary Health Care Research Institute, The German Institute for Quality and Efficiency in Health Care, andThe Health Foundation. • Core Topics: information technology and clinical record systems, access, care coordination, chronic care/use of teams, quality initiatives, and financial incentives. Source: 2006 Commonwealth Fund International Health Policy Survey of Primary Care Physicians.
THE COMMONWEALTH FUND Primary Care Practices:Use of Information Technology andClinical Information Systems
Figure 1. Primary Care Doctors’ Use ofElectronic Patient Medical Records, 2006 Percent Source: 2006 Commonwealth Fund International Health Policy Survey of Primary Care Physicians.
Figure 2. Electronic Medical Record System Access Source: 2006 Commonwealth Fund International Health Policy Survey of Primary Care Physicians.
Figure 3. Practice Use of Electronic Technology Source: 2006 Commonwealth Fund International Health Policy Survey of Primary Care Physicians.
Figure 4. Doctor Routinely Receives Alert AboutPotential Problem with Drug Dose/Interaction Percent Source: 2006 Commonwealth Fund International Health Policy Survey of Primary Care Physicians.
Figure 5. Doctor Routinely Receives Alert toProvide Patients with Test Results Percent Source: 2006 Commonwealth Fund International Health Policy Survey of Primary Care Physicians.
Figure 6. Patients Routinely Sent Reminder Noticesfor Preventive or Follow-Up Care Percent Source: 2006 Commonwealth Fund International Health Policy Survey of Primary Care Physicians.
Figure 7. Capacity to Generate Patient Information Percent of primary care practices reporting easy to generate Source: 2006 Commonwealth Fund International Health Policy Survey of Primary Care Physicians.
Figure 8. Primary Care Practiceswith Advanced Information Capacity Percent reporting seven or more out of 14 functions* * Count of 14: EMR, EMR access other doctors, outside office, patient; routine use electronic ordering tests, prescriptions, access test results, access hospital records; computer for reminders, Rx alerts, prompt tests results; easy to list diagnosis, medications, patients due for care. Source: 2006 Commonwealth Fund International Health Policy Survey of Primary Care Physicians.
THE COMMONWEALTH FUND Access Experiences and Office Hours
Figure 9. Doctor’s Practice Has Arrangement forPatients’ After-Hours Care to See Nurse/Doctor Percent Source: 2006 Commonwealth Fund International Health Policy Survey of Primary Care Physicians.
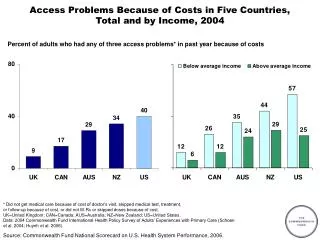
Figure 10. Physicians’ Perception of Patient Access Patients Often Have Difficulty Paying for Medications Patients Often Experience Long Waits for Diagnostic Tests Percent Percent Source: 2006 Commonwealth Fund International Health Policy Survey of Primary Care Physicians.
THE COMMONWEALTH FUND Coordination of Care
Figure 11. Doctors’ Reports of Care Coordination Problems Source: 2006 Commonwealth Fund International Health Policy Survey of Primary Care Physicians.
Figure 12. Receive Information Back AfterReferrals of Patients to Other Doctors/Specialists Percent reporting receive for “almost all” referrals (80% or more) Source: 2006 Commonwealth Fund International Health Policy Survey of Primary Care Physicians.
Figure 13. Length of Time to Receivea Full Hospital Discharge Report Percent saying 15 days or more or rarely receive a full report Source: 2006 Commonwealth Fund International Health Policy Survey of Primary Care Physicians.
THE COMMONWEALTH FUND Care for Chronically Ill Patientsand Use of Teams
Figure 14. Percent of Doctors Reporting PracticeIs Well Prepared to Care for Chronic Diseases Source: 2006 Commonwealth Fund International Health Policy Survey of Primary Care Physicians.
Figure 15. Capacity to Generate List of Patients by Diagnosis Percent reporting very difficult or cannot generate Source: 2006 Commonwealth Fund International Health Policy Survey of Primary Care Physicians.
Figure 16. Doctor Routinely Gives Patients withChronic Diseases Plan to Manage Care at Home Percent giving written plan Source: 2006 Commonwealth Fund International Health Policy Survey of Primary Care Physicians.
Figure 17. Use of Multidisciplinary Teamsand Non-Physicians Source: 2006 Commonwealth Fund International Health Policy Survey of Primary Care Physicians.
THE COMMONWEALTH FUND Quality Initiatives
Figure 18. Physician Participation in Activitiesto Improve Quality of Care Source: 2006 Commonwealth Fund International Health Policy Survey of Primary Care Physicians.
Figure 19. Availability of Data on Clinical Outcomesor Performance Source: 2006 Commonwealth Fund International Health Policy Survey of Primary Care Physicians.
Figure 20. Practice Had Documented Processfor Follow-Up/Analysis of Adverse Events Source: 2006 Commonwealth Fund International Health Policy Survey of Primary Care Physicians.
Figure 21. Primary Care Doctors’ Reports ofFinancial Incentives Targeted on Quality of Care * Receive or have the potential to receive. Source: 2006 Commonwealth Fund International Health Policy Survey of Primary Care Physicians.
Figure 22. Primary Care Doctors’ Reports ofAny Financial Incentives Targeted on Quality of Care Percent reporting any financial incentive* * Receive of have potential to receive payment for: clinical care targets, high patient ratings, managing chronic disease/complex needs, preventive care, or QI activities. Source: 2006 Commonwealth Fund International Health Policy Survey of Primary Care Physicians.
Figure 23. Primary Care: Summary and Implications • Striking differences across the countries in elements of primary care practice systems that underpin quality and efficiency. • Physicians in Australia, the Netherlands, New Zealand and the U.K. most likely to report multitask IT systems; U.S. and Canada lag behind. • Reports indicate varying capacity to care for patients with multiple chronic conditions or coordinate care with decision support. • Integration and coordination are a shared challenge. • Widespread primary care doctor participation in a range of quality improvement activities although safety tracking systems are rare except in the U.K. • U.S. stands out for financial barriers and also has limited after-hours access. Source: 2006 Commonwealth Fund International Health Policy Survey of Primary Care Physicians.
Figure 24. Opportunities to Learn to Inform Policy • Country patterns reflect underlying strategic policy choices and extent to which policies are national in scope: • Payment policies for quality and care management. • IT: Investing in primary care capacity and interconnectedness. • After-hours access. • Chronic disease management and use of teams. • Primary care “redesign” is central to initiatives to improve health care system performance internationally. • Evidence that national “system” focus is essential to build capacity. • Striking country differences in primary care practices and national initiatives offer rich opportunities to learn. Source: 2006 Commonwealth Fund International Health Policy Survey of Primary Care Physicians.
Acknowledgments With appreciation to: • Coauthors: Phuong Trang Huynh, Michelle M. Doty, Jordon Peugh, and Kinga Zapert, “On the Front Lines of Care: Primary Care Doctors’ Office Systems, Experiences, and Views in Seven Countries,” Health Affairs Web Exclusive (Nov. 2, 2006):w555–w571. • Developing and Conducting Survey:Harris Interactive and Associates. • Conducting Survey in the Netherlands: The Center for Quality of Care Research (WOK), Radboud University Nijmegen. • Cofunders: The Australian Primary Health Care Research Institute,The German Institute for Quality and Efficiency in Health Care, andThe Health Foundation. Source: 2006 Commonwealth Fund International Health Policy Survey of Primary Care Physicians.