Download
1 / 9
100 likes | 182 Vues
Learn about GDP calculations, economic growth implications, and analyzing GDP deflator. Understand the difference between nominal and real GDP. Evaluate economic growth based on output and price levels. Practice formative assessment questions.

E N D
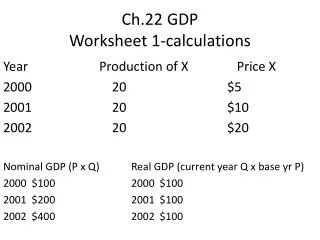
Ch.22 GDP Worksheet 1-calculations Year Production of X Price X 2000 20 $5 2001 20 $10 2002 20 $20 Nominal GDP (P x Q) Real GDP (current year Q x base yr P) • $100 2000 $100 • $200 2001 $100 • $400 2002 $100
Economic Growth? • What does it tell us when NGDP increases? • Could be increase in production • Could be increase in price • Could be combination of production and price • What does it tell us when RGDP increases? • …b/c P is held constant to base year • ….increase is due only to increase in Q • ….= ECONOMIC GROWTH
Year Production of X Price X 2000 20 $5 2001 20 $10 2002 20 $20 Nominal GDP (P x Q) Real GDP (current year Q x base yr P) • $100 2000 $100 • $200 2001 $100 • $400 2002 $100 Conclusions??? Economic growth? Price Levels? There was no economic growth. There was only an increase in price level
#2 Year P soda Q soda P jeans Q jeans NGDP RGDP 2000 $1 200 $10 50 a= $700 b=$700 • $1 220 $11 50 c= $770 d= $720 Mistake – avoid looking at each individual good – this is a model for the entire economy ex: conclude the economy grew for soda but not for jeans e. Value of GDP Deflator in 2000? NGDP / RGDP x 100 : always 100 in base year f. Value of GDP Deflator in 2001? 770/720 x 100 = 107 GDP = $$$$$$ Deflator is NOT $$ nor %% …IS index based on 100
g. from 2000-2001: prices rose approximately what percentage? • Compare GDP deflators – measure the change in price level • 2nd -1st / 1st • 107-100/100 = 7% • h. was the increase in NGDP from 2000-01 mostly due to an increase in real output or prices? • NGDP rose from $700 to $770 = 10% increase • Increase in real output = RGDP • 2000=$700 2001 = $720 2.85% (3%) • Increase in prices = Deflator = 7% • Conclude – 10%increase in NGDP was MOSTLY due prices (7%) vs. output (3%)
Evaluate • Was there economic growth? • Yes … • RGDP…. Or • Real output…. Or • ……the economy ……. • Grew at a 3% rate • The growth rate of the economy was 3% ….”normal growth” = 3% per year – long term trend since the 1950’s
………but……… • Price level or inflation increased by 7% • …..not good to have inflation outpace output • “normal” inflation is 1%-2%
#3 Complete Table Year NGDP RGDP GDP Deflator 1. ----- $100 100 2. $120 ---- 120 • $150 $125 ---- • Math : $x/$100 x 100 = NGDP $100 Logic: • Math: $120 /$x x100 = 120 RGDP = 100 Logic: ………see NGDP increase by 20% and Deflator increase by 20%.....so RGDP must not change • Math: $150/$125 x 100 = 120 see NGDP increase 25% and RGDP increase 25% ..then the increase is all due to output (RGDP) and no price increase…so….Deflator does not change
Formative Assessment • What does it mean to have economic growth? • What is the difference between Real GDP and Nominal GDP ?