Real-Time Metrics Dashboard for Diagonal View: Informative Analytics Solution
150 likes | 243 Vues
Diagonal View needs a real-time dashboard to enhance reporting efficiency, monitor key performance indicators, track historical data, and inform management and commercial teams about revenue insights. The dashboard design includes two sections with line charts, vital data sections, and easy customization features. The requirements emphasize accessibility, automation, visual data representation, and data feed aggregation from FreeWheel and Youme platforms. Proposals from developers are due by 25th March.

Real-Time Metrics Dashboard for Diagonal View: Informative Analytics Solution
E N D
Presentation Transcript
Metrics Dashboard for Diagonal View Brief for Developer
Basics of Diagonal View • We create original video content and distribute the content online across various platforms such as Youtube for mass consumption. When people watch the videos, they view advertisements from our partners and we make money from the advertisers. www.diagonal-view.co.uk
Dashboard Background • What is the need? • As the company has grown, its reporting needs have expanded. The current process is excel-based, manual and overly time-consuming for the team. Diagonal View needs a dashboard solution that will help it to understand key data in real-time without requiring staff to manually pull reports and format in excel. • What purpose does this Dashboard serve? • Inform management about what revenues they can expect • Inform commercial team about what changes they should make to their accounts • While there are two audiences, this should be consolidated into a single dashboard with two sections • What are we measuring? • Performance against key performance indicators • Current performance against historical performance • When is it needed? • The management team needs this dashboard as soon as possible, and therefore once the developer has been selected, Diagonal View would require development to commence immediately.
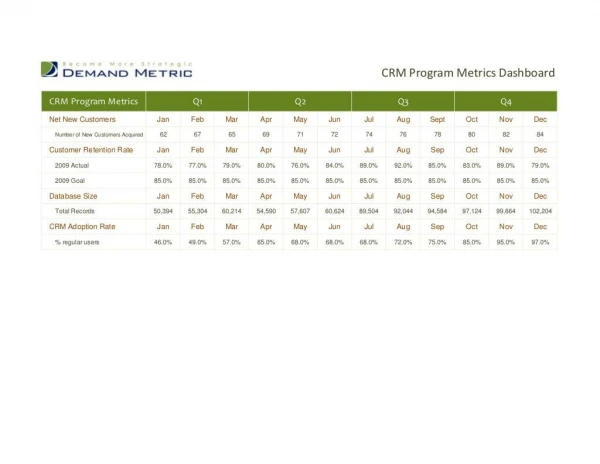
Dashboard DesignSingle dashboard with 2 distinct sections: Section A Section B Line charts to depict how current performance matches against historical performance Dashboard B should follow requirements from lists B and C Key sections: Revenue by platform Views by channel Consolidated p&l Revenue by partner Sell through Gross margins CPM Revenue by content Section A Section B • Measures performance against targets • Dashboard A should follow requirements from lists A and C • Key sections: • Views and revenue by platform vs goal • Revenue by partner vs goal and current CPM rates • Profit vs goal and current costs • Sell-through vs goal • Share of business by partner
Requirements of Both Dashboards (List C) • Key requirements for both dashboards: • Accessible anytime on any device • Updated as frequently as possible (e.g. daily) • Primarily visual • Automated to the greatest extent possible • Provide access the raw data to ensure it is leaning on the correct stats and therefore painting an accurate picture or story • Provide the ability to change, add to and remove dashboard elements easily or cost effectively after the first build • For example, adding in data feed from a new partners, platforms and channels • Ability to aggregate data feeds from FreeWheel and Youme • ***optional: if possible, create CMS or pull data from current CMS to scrape for views of all videos across all platforms
Section A Overview • Section A of the dashboard will help managers understand what profit to expect, as well as help management and commercial teams to measure performance against targets. • * A mock-up of the dashboard is contained in the following slide. While the resulting dashboard need not appear exactly like the mock-up, it should closely resemble and include all of the key elements.
Section A Requirements • Key requirements (list A): • All requirements from list C • Goal amounts (red, yellow and green sections) to be entered manually • Auto email notification when numbers in any of the segments hit the ‘red zone’ • Allow for manual override to data (occasionally data from sources will not be available or correct and an automated system may not pick this up) • Must allow for new platforms and partners to be added and deleted • Ideally, an email alert to show when discrepancies between streams and freewheel views for platforms exceeds 10% (this will be only applicable if we develop a scraping system in parallel to this dashboard)
Section B Overview • Section B consists of several line graphs to depict how current performance matches against historical performance. • * A mock-up of the dashboard is contained in the following slide. While the resulting dashboard need not appear exactly like the mock-up, it should closely resemble and include all of the key elements.
Section B Overview • Key requirements in addition to the key requirements list C: • All requirements from list C • On the horizontal axis for each line chart: quarterly average, monthly average, weekly average, today’s figure • Ability to take into account historical information (information may not be available via feed, so will need to be imported via excel) • Need to be able to add and remove channels • Need to make data clear, even though scale will differ (for example, Diagonal View has over 1M views per day while other channels get 10K views)
Next Steps • Developers to respond with proposal by 25 March. Proposals will be evaluated on the following: • Cost of initial build, testing and future support if required • Estimate of time required to build dashboard • Quality (please provide samples of work that you have done and/or recommendations from clients) • Diagonal View to respond by Monday 28 March: • Confirmation of which developer has been selected and feedback • Contract for winning developer
Appendix Additional information for your reference
Terminology Platform: • Platforms where DV videos are posted. Platforms get rev share on advertising • Examples: Daily Motion, MSN, Youtube, Myspace, Skype, Swagbucks, Yahoo, Facebook football, AOL Consumer: • Anyone who watches a video, particularly in North America (95% of value) • Content: • Stream: number of times a video is played on a platform • Ad Server View: number of times the ad server recognises that a video is played on a platform • Ad Server Ad Impression: number of times the ad server delivers an ad on a video that is played on a platform • Advertiser: • Either direct or agency representing the advertiser • Examples of direct: Reckitts • Examples of O&O: Outrigger • Resellers: Google, spotxchange, tremor, brightroll, yume, BBE Technologies: • Ad server: Freewheel, Yume • Player: Brightcove, Ooyaa
Partner Operations System Integrations for Tier 1 & 2 publishers: 5Min, YouTube + other indirect $1 CPM Content Uploaded $1 CPM CMS Brightcove player MSN Resellers: Tremor, Tidal, Brightroll, Specific, Crosspoint, Spotxchange, SmartClip etc YuMe Ad Server FreeWheel Ad Server Swagbucks, MiiTV Facbook Skype Own Sites + other Embeds MySpace DailyMotion + other VAST/VPAID O&O Campaigns: Outrigger etc