Download
1 / 18
180 likes | 277 Vues
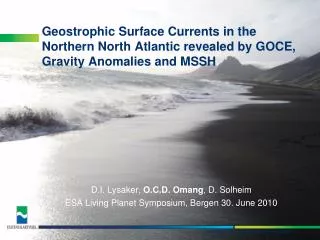
D.I. Lysaker, O.C.D. Omang , D. Solheim ESA Living Planet Symposium, Bergen 30. June 2010. Geostrophic Surface Currents in the Northern North Atlantic revealed by GOCE, Gravity Anomalies and MSSH. This presentation shows an example of how to use geodetic data in climate studies.

E N D
D.I. Lysaker, O.C.D. Omang, D. Solheim ESA Living Planet Symposium, Bergen 30. June 2010 Geostrophic Surface Currents in the Northern North Atlantic revealed by GOCE, Gravity Anomalies and MSSH
This presentation shows an example of how to use geodetic data in climate studies Gravity + MSSH Direct Synthetic Geostrophic ocean surface currents
Ocean circulation may be estimated if height above geoid is known www.science.nasa.gov Ocean Circulation and Transport between the North Atlantic and the Arctic Sea
OCTAS -Ocean Circulation and Transport between the North Atlantic and the Arctic Sea Courtesy Kourosh Ghazavi
OCCAM Oceanographic models • Salinity • Temperature
Synthetic MDT derived by subtracting a regional gravimetric geoid from a MSSH model Two methods for estimating geostrophic surface currents • Direct • MDT obtained using LSC • Combine MSSH and gravity data
Direct method uses LSC Cross-covariance between observations y and signal x MDT Covariance matrix for the measurement noise Auto-covariance of observations Error covariances a-priori signal variance matrix
Synthetic method MDT = MSSH – N + e
Data used in the direct and synthetic method MSSH (OCTAS06v3/DNSC08) Gravity data
Gravity coverage is not complete in our test area … fill with gravity data from altimetry
Both models give a lot of features Combined model (MSSH and Dg) Direct model (MSSH and N)
Geodetic model has smaller features than oceanographic model Geodetic model (MSSH-N) Oceanographic model (OCCAM)
Synthetic model fits drifter data better Average: 10.5 cm/s Standard deviation: 9.3 cm/s
Combination model and drifter data Average: 11.2 cm/s Standard deviation: 9.8 cm/s
Drifter data fits as good/bad with mooring data as combination model
Conclusions • Using geodetic data reveals smaller features than oceanographic models • Redistribution of water is due to change in climate • Gravity observations may contribute to monitor this change