Download

1 / 24
240 likes | 443 Vues
Financial Projections That Guarantee A Winning Proposal. Aldis Jakubovskis Ron Mueller Lynette Watson Missouri SBTDC ASBDC Annual Conference – San Diego 2011. Agenda. Financial projections spreadsheet tool; Developing and validating financial assumptions;

E N D
Financial Projections ThatGuarantee A Winning Proposal Aldis Jakubovskis Ron Mueller Lynette Watson Missouri SBTDC ASBDC Annual Conference – San Diego 2011
Agenda • Financial projections spreadsheet tool; • Developing and validating financial assumptions; • How the clients can get the most benefit from the cash flow projection process
St. Louis SBTDC Cash Flow Projections Tool • Location: www.missouribusiness.net/sbtdc/docs/fin_proj.xls • Utilizing the functionality and flexibility of Excel; • Advantages: • Maximum adaptability to different business cases; • Convenience of minimal data entry, focus on entering the assumptions vs. the dollar figures; • Integrated worksheet that serves as a “hub” for user-created sheets (both “linked in” and “linked out”)
Maximum Adaptability • Every business case is different (start-up vs. existing businesses, product based businesses vs. service based businesses, etc.); • A good cash flow projections spreadsheet must have both (possibly contradictory requirements): • Automate as much work as possible; • Accommodate as much business-specific details as possible
Focus on Entering the Assumptions • Whenever possible, the data is entered as assumptions rather than dollar figures; • Examples: • Loan amortization: interest rate, term, start date, original balance; • Depreciation: useful life, current age, original cost; • Operating capital; days A/R, days A/P, days inventory; • Percentages: COGS, payroll tax • Easier ‘what-if’ analysis
Integration and Linking • Income statement, balance sheet and cash flow statement are fully integrated, guaranteeing mathematical and accounting correctness; • Main ‘worksheet’ as a hub: • User-created sheets can be “linked in”, (e.g., a detailed industry-specific revenue model); • User-created sheets can be ‘linked out” (e.g., sheets formatted for print, sheets for break-even and ratio analysis, sheets for graphs) • Worksheet protected and formula cells locked
Other Features • Automatically set the start month; • For convenience, the data entry rows in the income statement by default are set to allow the population of the whole row by entering a value in the first cell (this can be changed by the user as needed); • Spreadsheet is originally set for 3 years on monthly basis; can be extended to any number of years by simply “select-drag-drop”
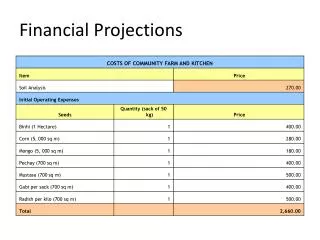
Developing Financial Assumptions • Project cost and uses of funds: • Start-up; • Expansion; • Business acquisition • Revenue model; • Monthly operating expenses
Sources of Information • Previous performance results; • Comparable businesses; • Field research; • Trade associations; • Publications: • RMA, • Etc…
Validation of Assumptions • Look for multiple sources to re-enforce and validate from different perspectives; • Indicate the sources of information; • Each industry has its own specific rules of thumb
Project Cost • Develop itemized list: • Purchase of long-term assets; • One-time expenses (for start-ups); • Working capital; • Other? • Identify sources of funds
Revenue Model • One size does not fit all businesses – but… some industries have “cookie cutter” models: • Restaurants; • Professional services; • Construction • No need to reinvent the wheel
Geographic Differences • Location impacts the revenues: • States; • Regions; • Metro areas; • Rural areas
Industry Differences • Use industry standard information when available; • Not all businesses within a sector (e.g., retail) are the same: • Example: fashion boutique • Service – what adds value?
Seasonal Differences • Holidays • More than just the Christmas season • Tourist season; • The benefit plan season; • Know the seasonal factors: • Dramatically impacts the revenue projections and cash needs
Revenue Model Must be Consistent With the Marketing Plan • Demographic target and purchase frequency; • Product/service positioning and pricing; • Luxury or necessity; • Competitive factors
Considerations for Collecting Payments • Cash (% of revenues); • Invoice with terms (% of revenues); • Third party payers: • Insurance companies; • Federal/state agencies • Discounts; • Special offers and plans
Revenue Assumptions: Additional Considerations • Business may have multiple profit centers (product/service categories or NAICS codes) • Profit margins rarely the same for each center • Business may have multiple locations with different financial dynamics • E.g., one location may use old equipment or have less profitable customer base • Use industry specific terms • E.g., “Billings” not “Sales” for a medical practice
Growth Effects • The rate of growth must take into account: • Material requirements; • Human resource requirements; • Facility requirements; • Capital requirements; • Replacement of existing assets year two/three • Start-up vs. existing – the ramp-up time
Monthly Operating Expenses • Some expenses are more certain than the others; • Allocate expenses evenly between months when there is no basis to do otherwise (for example, hard to assign repairs and maintenance to specific months); • Provide detailed explanations for the major expense categories;
Don’t Overlook Certain Expenses • Bank services charges • Fees for debit/credit cards • Contract services: • Security; • Snow and waste removal; • Continuing education; • Workman’s compensation insurance
Break-even Analysis and Debt Coverage Ratio • Emphasize the benefits of understanding the break-even concept; • Aim for slightly above break-even – can’t go wrong… • Vast majority of industries have the profit before taxes in the 0-10% range • Make sure the projections “cash flow” – safe DCR 1.3-1.5
Some Numbers Are More Important Than the Others • Look at your monthly sales, for example, if monthly sales are $20,000, don’t worry about a $100 expense – it is only 0.5%; • Pay attention to major expense categories first – look at the BIG PICTURE, don’t get bogged down with minutia
Projections Have to be “Elegant” • Have to be easy to understand; • Use level estimates, if there is no reasonable basis for differences between months (when appropriate); • Round estimated numbers to 1,000s, 100s, etc. – zeros indicate that they are estimates, and the number of zeros indicate the assumed accuracy of these estimates