Honey Market Analysis
590 likes | 988 Vues
Honey Market Analysis. FRE 502 Amber Chen Zhuo Victor. Agenda of Presentation. Introduction. History of Honey : At least 8,000 years ago. C ulture: European & Asia. 1851, Lorenzo Langstroth (Father of modern apiculture) Produce Procedure http ://honeylore.com

Honey Market Analysis
E N D
Presentation Transcript
Honey Market Analysis FRE 502 Amber Chen Zhuo Victor
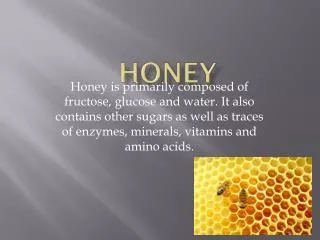
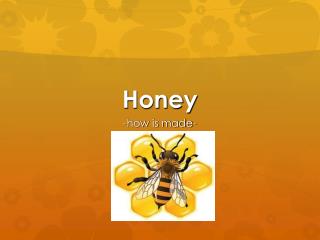
Introduction History of Honey: At least 8,000 years ago. Culture: European & Asia. 1851, Lorenzo Langstroth (Father of modern apiculture) Produce Procedure http://honeylore.com By Product: Beeswax
Introduction ConsumerBehavior: Arvanitoyannis andKrystallis (2006) Medical benefits; Dietary quality; Ethical character of honey; Lifestyle.
Introduction Usageof Honey: Honey for direct consumption Honey as an ingredient in products Industrial honey Raw material for Mead ( Honey Wine)
Introduction Main Exporters: China, Argentina, Mexico. Main Importers: US, EU, Japan. Current Threat: Collapse Colony Disorder Remained stable 1990s at 17%-20%. 2007~2010 34% loss
World honey production Production increased but yield per beehive remained fairly constant suggests that the number of beehives increased across the years. R&D may NOT play a role in increasing the amount of honey per beehive (upper limit)
total production Value The current value of world honey production represents the market value of honey at the time they were produced.
production price World Gross Production Value (million US$)/Total World Production (tonnes) = Unit Value of honey ($/tonne)
production price Another way to examine price movements: the ratio of current value of honey production (million US$) and value of honey production in constant terms is calculated (constant 2004-2006 million US$). Current value => Price measure Constant value => Volume measure
Honey export and import prices Highly coherent export and import price trends => An excellent real world example of the three panel diagram!
Structure of honey market Around 30% world production traded (quite thick) and the trend is fairly stable • Big producers are also bigtraders (implies that the market is concentrated and more stable) • High X concentration and high M concentration • China is the top producer and the top exporter. However, US is a both a dominant producer and the top importer.
Honey importers 1990-2002: the three importers’ price movements are quite synchronized. 2002-2004: EU price > US price > Japan price 2005-2010: EU price > US and Japan price Implication: EU imports higher quality honey across the years and this is getting very obvious in recent years.
Honey importers CR3 is relatively stable and flat across the years. High degree of concentration of around 80%.
Honey Exporters 1990-2000: the three exporters’ price movements are quite similar. 2000-2010: Argentina and Mexico prices > China price (Gap widened in the last three years) Implication: China is either exporting lower quality honey or is having comparative advantage due to price competitiveness.
Honey Exporters CR3 is showing a gentle decreasing trend across the years from 60% in 1990 to 40% in 2010
A comparison of the 3 Honey Exporters Revealed Comparative Advantage Index: Xij: Export Country’s Honey Export Value Xit: Export Country’s Total Merchandise Export Value Xwj: World’s Honey Export Value Xwt: World’s Total Merchandise Export Value As long as RCA>1, the honey exporter has revealed comparative advantage. The bigger the value of RCA, the stronger the comparative advantage internationally.
A comparison of the 3 Honey Exporters Argentina’s RCA index is notably higher than Mexico and China’s RCA index. Both Mexico and China have a decreasing trend over the years.
Zooming into china US anti-dumping policy EU ban on China honey export
Special Issues 1 EU Consumption from 1990~2010. Source: FAO World Principle Importer of Honey. Long history of consume honey as a healthy food. Continuous Growth
Special Issues 1 EU: Higher Consumer Surplus. High-Standard Product. Organic and Fair-trade Honey. A. In 2002, EU banned the honey from China. --- Banned Antibiotic material B. In 2007, EU banned the honey from Brazil. --- No Agreement on Testing procedure and Standard C. China lost Market Share. -----Argentina, Mexico, Chile, Brazil Take over.
Special Issues 1 Opportunities and Threats: Organic honey & Fair trade honey (UK In 2004 organic honey, 6.8%, 28% increase previous year) CCD (Collapse Colony Disorder) -----Unknown, No Solution. Strong EURO Source: FAO
Special Issues 1 Source: CBI Market Survey
Special Issues 2 Anti-dumping Duty: In 1992, US , anti-dumping duty, China Honey. Revoked at 2000. (157% Preliminary anti-dumping duty) Put an anti-dumping . Again. In 2001. Chinese Companies Appeal. Final 183% antidumping
Special issues 2 Sb ES Sa P3 P1 P2 P2 ED1 Db ED2 Da Q1 d a c b China World Market US Tariff Imposed in US: World P drops from P1 to P2 (in export country); Price rises to P3 in import country; P3 - P2 = tariff
Special Issues 2 China Honey Market Share in US
Special Issues 2 Reasons One : Honey-Rice Syrup Mixture from China. ------2012, August 21, the U.S. Department of Commerce. Final anti-circumvention ruling on Chinese honey states honey-rice syrup circumvented the U.S. antidumping duty order. Syrup: A thick, viscous liquid consisting a large amount of sugar.
Special Issues 2 Reason Two: China Honey Re-Route: To Avoid Anti-dumping duty. 3 Steps of Trading: Export to another company. Re-label honey, Change country of origin. Companies in USA import it. Source: www.downtoearth.org.in/node/1953
Special Issues 2 Alfred L Wolff Gmbh (ALW).Ltd. (offices in Hamburg, Chicago, Beijing and Hong Kong) Originating in South Korea to avoid U.S. anti-dumping duties. 2-Years Sentence. --------US.ICE Source: http://www.ice.gov/news/releases/1206/120626chicago.htm
Us honey market • Outline: • Characters of US honey market • Policy analysis- honey program Source: http://outdoorplace.org/beekeeping/honey1.htm
Us market-decreasing production ld WARD, R., BOYNTON, B.. U.S. Honey Supply Chain: Structural Change, Promotions and the China Connection. International Journal on Food System Dynamics, North America, 1, jan. 2010. Available at: http://131.220.45.179/ojs/index.php/fsd/article/view/6. Date accessed: 20 Nov. 2012.
Us market-INCREASING CONSUMPTION Data from: FAO
Us market-INTEGRATED PRICE Data from: FAO
Overview of the trend Canada, Carol. Farm Commodity Programs: Honey. Washington D.C., USA . UNT Digital Library. http://digital.library.unt.edu/ark:/67531/metacrs8892/. Accessed November 19, 2012.
Us honey program(1952-?) Outline: Origin Development Recent policy analysis
Us HONEY PROGRAM Origin: During world war 2: honey was produced as a nation priority(substitution for sugar) beeswax for military use >>>demand high, price high After the second world war: demand for honey largely decrease Substitution: sugar, largely available >>>>demand declines, price largely decrease. . Figure retrieve from:Canada, Carol. Farm Commodity Programs: Honey. Washington D.C., USA . UNT Digital Library. http://digital.library.unt.edu/ark:/67531/metacrs8892/. Accessed November 19, 2012.
Effective? The production is still declining, effect can’t be observed Factors: World price higher than produce price (fund available) CCD is still under no control ( still can’t find reason,there are several reason, but not convincing) Imported honey Why: Pollination is important for all corps, not only the economic value of honey. (also professional beekeepers income source)
Conclusion World Market of Honey: The competitive advantages of China, Argentina, Mexico. The market trend of honey. Special Issues: EU Premium in Honey Market. CCD Anti-dumping duty of China Honey. US Honey Market: US Policy Support.
Reference WARD, R., BOYNTON, B.. U.S. Honey Supply Chain: Structural Change, Promotions and the China Connection. International Journal on Food System Dynamics, North America, 1, jan. 2010. Available at: http://131.220.45.179/ojs/index.php/fsd/article/view/6. Date accessed: 20 Nov. 2012. Canada, Carol. Farm Commodity Programs: Honey. Washington D.C., USA . UNT Digital Library. http://digital.library.unt.edu/ark:/67531/metacrs8892/. Accessed November 19, 2012.