
Brain Atrophy Analysis in ALS and ALS-FTD Patients Compared to Controls
This study employs voxel-based morphometry to analyze grey matter atrophy in patients with Amyotrophic Lateral Sclerosis (ALS) and ALS-Frontotemporal Dementia (ALS-FTD) compared to healthy controls. Significant atrophy clusters are displayed on the MNI standard brain, showing unique patterns of atrophy for ALS versus controls, ALS-FTD versus controls, ALS versus ALS-FTD, and ALS-FTD versus ALS. Statistical significance is highlighted with thresholds of p < 0.05 FWE corrected and p < 0.001 FDR corrected for select comparisons, with clusters comprising at least 50 contiguous voxels.

Brain Atrophy Analysis in ALS and ALS-FTD Patients Compared to Controls
E N D
Presentation Transcript
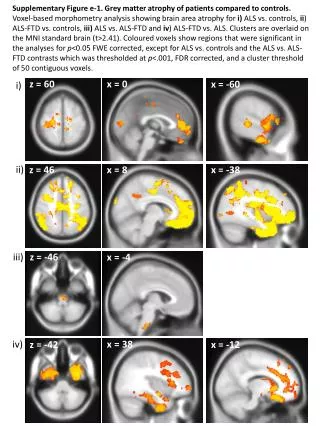
Supplementary Figure e-1.Grey matter atrophy of patients compared to controls. Voxel-based morphometry analysis showing brain area atrophy for i) ALS vs. controls, ii) ALS-FTD vs. controls, iii) ALS vs. ALS-FTD and iv) ALS-FTD vs. ALS. Clusters are overlaid on the MNI standard brain (t>2.41). Coloured voxels show regions that were significant in the analyses for p<0.05 FWE corrected, except for ALS vs. controls and the ALS vs. ALS-FTD contrasts which was thresholded at p<.001, FDR corrected, and a cluster threshold of 50 contiguous voxels. z = 60 x = 0 x = -60 i) ii) x = 8 x = -38 z = 46 iii) z = -46 x = -4 iv) x = 38 z = -42 x = -12