Download
1 / 21
210 likes | 364 Vues
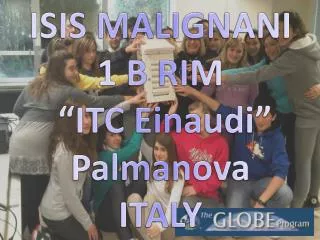
ISIS MALIGNANI 1 B RIM “ITC Einaudi” Palmanova ITALY . Our “adventure” began one day in October, when our Science teacher got us involved in an international project called SCRC, part of the Globe program.

E N D
ISIS MALIGNANI 1 B RIM “ITC Einaudi” Palmanova ITALY
Our “adventure” began one day in October, when our Science teacher got us involved in an international project called SCRC, part of the Globe program. This campaign aims at collecting meteorological data worldwide, in order to establish whether climate changes are happening in our planet.
First of all, we started downloading and translating the protocols from the Globe website that we would then use to follow the standard procedure for building the instruments and carrying on the project.
We constructed the instruments to collect meteorological data!
This is our meteorological station, built to protect the maximum and minimum termometre, the barometer and hygrometer.
In March 2012, every day, four of us would go outside to collect the meteorological data.
Precipitations • From the data, we can infer that March 2012 was a peculiar month as it was characterized by lack of rain and high temperatures. In the previous years, in March, rains had been more frequent and the mean temperatures lower. For instance, in March 2010 and 2011, 74.3 mm and 93.2 mm of rain had fallen, respectively; whilst in March 2012 no rain was measured.
As far as temperature is concerned, in March 2009, the average temperature was 8.2 °C, in 2010 it was 7.7 °C and in 2011 it was 8.9°C; however in March 2012 the average temperature was 21.6°C! • We cannot be certain that climate changes are actually occurring since they generally happen in a period of 30-40 years; but, surely, there is a remarkable difference in the average temperatures and precipitations between March 2012 and March of the previous years. TEMPERATURA
Land Cover We also built the instruments for the “Land Cover” which allowed us to get statistics about the vegetation cover of some areas. We sent our data to the Globe website, so that they could be added to those collected with the satellite.
This is the clinometre, a instrument to gauge the height of trees… and the densiometre, used to measured the vegetation cover.
And here is the wood in Muzzana where our measurements were taken!
Land Cover • Land Cover is used to describe the vegetation in the chosen area (located with the GPS) and the type and amount of cover of the soil and to catalogue them following the MUC protocol. • This allows to integrate the data collected with in area covered by woods.