Download
1 / 13
130 likes | 412 Vues
Measurement of Thermal Infrared Radiation Emitted by the Atmosphere Using FTIR Spectroscopy. By Narayan Adhikari Charles Woodman. Overview. Electromagnetic radiation spectrum Interaction of gases with IR radiation Black body emission FTIR spectroscopy FTIR measurements at UNR

E N D
Measurement of Thermal Infrared Radiation Emitted by the Atmosphere Using FTIR Spectroscopy By NarayanAdhikari Charles Woodman
Overview • Electromagnetic radiation spectrum • Interaction of gases with IR radiation • Black body emission • FTIR spectroscopy • FTIR measurements at UNR • Conclusions • Future work
What is thermal infrared radiation? Gamma X-Ray UV Infrared Microwaves Radio waves IR radiation: part of EM radiation ( 0.7m – 1 mm) Thermal IR band: 4 – 50 m Approx. 99% of the radiation emitted by the Earth and its atmosphere lies in thermal IR band. Wavelength (microns) Electromagnetic radiation spectrum
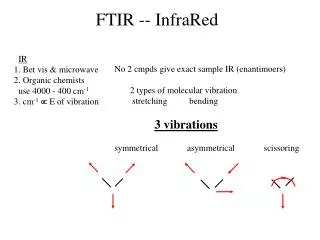
How do gases interact with IR radiation? Vibrational and rotational transitions are associated with weak energy corresponding to IR and microwave radiation. Green-house gases like CO2, H2O vapor, O3, CH4, CFCLs and N2O etc. absorb and re-emit IR radiation at different wavelengths. Energy states of carbon dioxide molecule Photon energy: Energy states of water molecule • Energy of photon absorbed = difference • in energy states
Black body emission* • Emission: conversion of internal • energy into radiant energy Black body emission curves at terrestrial temperatures For a black body: a = 1, = 1 Planck’s function: Wien’s displacement law: BB emission curves of the Sun and Earth ( scaled by a factor of 10-6 ) 90 Sun 80 T = 5780 K 70 60 50 (scaled by a factor of 10-6). Important ! The Earth and the atmosphere are the major sources of thermal IR radiation. 40 radiative flux ( W m-2m-1) Earth 30 20 T = 288 K 10 0 0.1 0.2 0.4 1 2 4 10 20 50 100 wavelength (m) *Adapted from G.W. Petty 2nd edition
FTIR spectroscopy • FTIR: Fourier transform of infrared radiation. • It measures the intensity of the IR radiation emitted by a source. • It consists of: (a) Michelson interferometer and (b) computer for Fourier transform. path difference = x1 - x2 measured interferogram movable mirror X2 beam-splitter computed spectrum fixed mirror source X1 interferogram detector note: = 1/ (cm-1): wavenumber Fourier transform spectrum R() interferogram, ID
Calibration of FTIR spectrometer hot BB window mirror Circulation water in Circulation Water Out Brass Cone cold BB 5 cm Thermistor probe Black Paint FTIR spectrometer 30cm • b = (V1-V2)/(B1-B2) • a = [ V1(B1-B2) - B1(V1-V2) ]/(B1-B2) • Finally the calibrated target radiance is given by • R() = [ (B1 - B2) V+ V1B2 - V2B1 ] / (V1 - V2) • Assumed linear model for spectral response: • V() = a() + b () R() • ▪ V(): detector voltage • ▪ R(): target radiance • ▪ R() = B() for perfect black body at temperature T • ▪ a() and b() are calibration factors. • With the measurements of cold and hot black • bodies, we obtain a and b as follows:
Infrared radiative transfer model(non- scattering atmosphere) TOA Ttop 0 Radiant intensity at reaching the sensor at ground is: where : Planck’s emission function (transmittance at ) K: absorption coefficient of an absorbing gas q(p): mixing ratio of the absorbing gas (g/Kg) Tm pm T2 p2 T1 p1 Ts surface ps • The IR radiation emitted from each layer of the atmosphere suffers partial absorption • and transmission in the lower layers of the atmosphere before reaching the ground.
Measurement of downwelling IR radiation with FTIR at UNR Cloudy sky, 01 Apr., 2010 ( 10 am) Clear sky, 06 Apr., 2010 ( 10 am) • The atmosphere seems to be opaque at • the strong IR absorption bands & FTIR • records the emission from the • atmosphere right by it i.e. the surface. • Atmospheric ‘dirty’ window region for IR • radiation: 800 – 1300 cm-1 • The atmosphere is more transparent at • this region and FTIR records emission • from the higher atmosphere. • Cloudiness affects radiance throughout • IR band. • note: 1 cm-1 = 0.04 m and 1 m = 25 cm-1. Cloudy Clear
Comparison between FTIR and weather balloon measurements • Brightness temperature (Tb): • For = 1, Tb physical temperature (T) • For 1, Tb T. Surface temperature brightness temperature of upper atmosphere • The surface brightness temperature (280 K) observed by FTIR • is very close to that recorded by weather balloon. • The higher brightness temperature in H2O vapor absorption band • infers the abundance of water vapor near the surface as well as the • slight temperature inversion effect. Weather balloon sounding at Reno, NV (May 02, 2010: 5.00 am)
Conclusions • A good agreement between FTIR and weather balloon soundings suggests the accuracy of the FTIR. • Since the normal frequency of weather balloon launches is 12h, the FTIR provides much better temporal resolution of the atmospheric features than the weather balloon does. • FTIR sounding data together with satellite sounding data can yield entire tropospheric vertical profiles of temperature and water vapor.
Future work With FTIR measurements, we can retrieve the temperature and humidity profile of the atmospheric boundary layer (ABL). frequently update the primary meteorological parameters of Reno which will be helpful to: - monitor the air quality by estimating potential air pollution dilution in Reno. - predict daily weather of Reno. - study the diurnal and seasonal variation of air quality in Reno.


![Fourier transform infrared spectroscopy[FTIR]](https://cdn1.slideserve.com/2743434/fourier-transform-infrared-spectroscopy-ftir-dt.jpg)