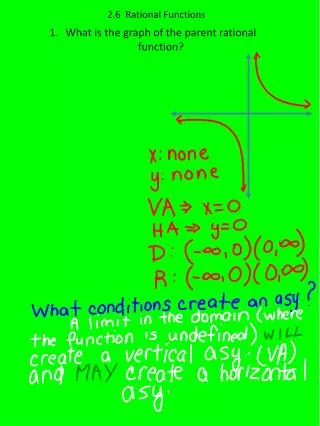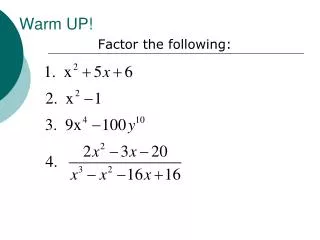
Mastering Rational Function Graphing: Holes & Asymptotes Review
Learn the steps for graphing holes, vertical asymptotes, and horizontal asymptotes with clear examples. Understand the discontinuous parts of graphs, holes at specific x-values, and cases for HA.

Mastering Rational Function Graphing: Holes & Asymptotes Review
E N D
Presentation Transcript
Review: STEPS for GRAPHING HOLES ___________________________________________ ___________________________________________ EX _________________________________________ EX _________________________________________ Discontinuous part of the graph where the line jumps over. Represented by a little open circle. Hole @ x = 3 Hole @ x = 2 No hole at x = 0
Review: STEPS for GRAPHING VERTICAL ASYMPTOTES ___________________________________________ ___________________________________________ EX _________________________________________ EX _________________________________________ Discontinuous part of the graph where the line cannot cross over. Represented by a dotted line called an asymptote. VA @ x = 2 Hole @ x =0 VA @ x = 2, -5
Review: STEPS for GRAPHING HORIZONTAL ASYMPTOTES n = degree of numerator d = degree of denominator _______________________________________________ _______________________________________________ _______________________________________________ No HA Case 1 n > d HA @ y = 0 Case 2 n < d HA is the ratio of coefficients HA @ y = 4 / 5 Case 1 n = d
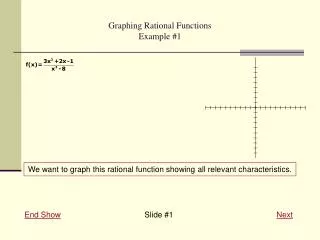
Finding holes and asymptotes VA: none (graph is the same as y=x-1 once the (x-2)s cancel HA: none (degree of the numerator is greater than the denominator) Hole: x=2 VA: x=-1, -5 HA: y=0 (power of the denominator is greater than the numerator) Holes: none
Let’s try some Find the vertical, horizontal asymptotes and any holes VA: x=3 HA: none (power of the numerator is greater than the denominator) Holes: x=2 VA: x=-5,0 ( cancel the (x-3)s HA: y=0 (degree of the denominator is greater than the numerator) Hole: x=3
GRAPHING y = x / (x – 3) 1) HOLES? no holes since nothing cancels • VERTICAL ASYMPTOTES? • Yes ! VA @ x =3 3) HORIZONTAL ASYMPTOTES? Yes ! HA @ y =1 4) T-CHART X Y = x/(x – 3) 4 • Y = 4 2 • Y = -2 0 • Y = 0 5 • Y = 5/2
GRAPHING hole @ x = -1 1) HOLES? • VERTICAL ASYMPTOTES? None! 3) HORIZONTAL ASYMPTOTES? None! 4) The graph - Graph the function y=x with a hole at x=-1 What cancels?
GRAPHING 1) HOLES? hole @ x = 0 • VERTICAL ASYMPTOTES? Yes ! VA @ x =-2 , 5 3) HORIZONTAL ASYMPTOTES? Yes ! HA @ y =0 (Power of the denominator is greater than the numerator) 4) T-CHART X 6 • Y = 1/2 WAIT – What about the Horizontal Asymptote here? -3 • Y = -5/8 1 • Y = 1/12 2 • Y = 0 3 • Y = -1 / 10
Remember, Horizontal Asymptotes only describe the ends of the function (left and right). What happens in the middle is ‘fair game’. T-CHART X Left -1 • Y = 1/2 To find out what the graph looks like between the vertical asymptotes, go to a T Chart and plug in values close to the asymptotes. 4 • Y = -1/3 Right Middle 2 • Y = 0
Let’s try one: Sketch the Graph 1) HOLES? none • VERTICAL ASYMPTOTES? Yes ! VA @ x = 1 3) HORIZONTAL ASYMPTOTES? Yes ! HA @ y =0 (Power of the denominator is greater than the numerator) 4) T-CHART X • Y = 0 0 -1 • Y = 1/4 • Y = .22 -2 2 • Y=-2 3 • Y = -3/4