Exploring Randomness: Delusions and Opportunities
Exploring Randomness: Delusions and Opportunities . LS 812 Mathematics in Science and Civilization. November 3, 2007. Sources and Resources. Nassim, Nicholas Taleb Fooled by Randomness, Second Edition, Random House, New York.

Exploring Randomness: Delusions and Opportunities
E N D
Presentation Transcript
Exploring Randomness: Delusions and Opportunities LS 812 Mathematics in Science and Civilization November 3, 2007
Sources and Resources • Nassim, Nicholas Taleb Fooled by Randomness, Second Edition, Random House, New York. • Weldon,K.L. Everyday Benefits of Understanding Variability. Presented at Applied Statistics Conference, Ribno, Slovenia. September, 2007. • www.stat.sfu.ca/~weldon
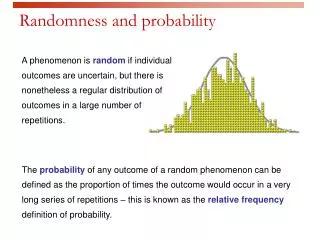
Introduction • Randomness is about Uncertainty - e.g. Coin • Is Mathematics about Certainty? - P(H) = 1/2 • Mathematics can help to Describe “Unexplained Variability” • Randomness concept is key for “Probability” • Probability is key to exploring implications of “unexplained variability”
Abstract Real World Mathematics Applications of Mathematics Randomness Applied Statistics UsefulPrinciples Surprising Findings Ten Findings and Associated Principles
Example 1 - When is Success just Good Luck? An example from the world of Professional Sport
Recent News Report “A crowd of 97,302 has witnessed Geelong break its 44-year premiership drought by crushing a hapless Port Adelaide by a record 119 points in Saturday's grand final at the MCG.” (2007 Season)
Are there better teams? • How much variation in the total points table would you expect IFevery team had the same chance of winning every game? i.e. every game is 50-50. • Try the experiment with 5 teams. H=Win T=Loss (ignore Ties for now)
5 Team Coin Toss Experiment • Win=4, Tie=2, Loss=0 but we ignore ties. P(W)=1/2 • 5 teams (1,2,3,4,5) so 10 games as follows • 1-2,1-3,1-4,1-5,2-3,2-4,2-5,3-4,3-5,4-5 My experiment … • T T H T T H H H H T Experiment Result -----> But all teams Equal Quality (Equal Chance to win)
Implications? • Points spread due to chance? • Top team may be no better than the bottom team (in chance to win).
Does it Matter? Avoiding foolish predictions Managing competitors (of any kind) Understanding the business of sport Appreciating the impact of uncontrolled variation in everyday life
Point of this Example? Need to discount “chance” In making inferences from everyday observations.
Example 2 - Order from Apparent Chaos An example from some personal data collection
Gasoline Consumption Each Fill - record kms and litres of fuel used Smooth ---> Seasonal Pattern …. Why?
Pattern Explainable? Air temperature? Rain on roads? Seasonal Traffic Pattern? Tire Pressure? Info Extraction Useful for Exploration of Cause Smoothing was key technology in info extraction
Is Smoothing Objective? 1 2 3 4 5 4 3 2 1 2 3 4 5 Data plotted ->>
Optimal Smoothing Parameter? • Depends on Purpose of Display • Choice Ultimately Subjective • Subjectivity is a necessary part of good data analysis
Summary of this Example • Surprising? Order from Chaos … • Principle - Smoothing and Averaging reveal patterns encouraging investigation of cause
Example 3 - Utility of Averages • Understanding them can contribute to your wealth! -1 .5 0 3 AVG = .38
Preliminary Proposal I offer you the following “investment opportunity” You give me $100. At the end of one year, I will return an amount determined by tossing a fair coins twice, as follows: $0 ………25% of time (TT) $50.……. 25% of the time (TH) $100.……25% of the time (HT) $400.……25% of the time. (HH) Would you be interested?
Stock Market Investment • Risky Company - example in a known context • Return in 1 year for 1 share costing $10.00 25% of the time0.50 25% of the time1.00 25% of the time4.00 25% of the time i.e. Lose Money 50% of the time Only Profit 25% of the time “Risky” because high chance of loss
Independent Outcomes • What if you have the chance to put $1 into each of 100 such companies, where the companies are all in very different markets? • What sort of outcomes then? Use coin-tossing (by computer) to explore
Diversification Unrelated Companies • Choose 100 unrelated companies, each one risky like this. Outcome is still uncertain but look at typical outcomes …. One-Year Returns to a $100 investment
Looking at Profit only Avg Profit approx 38%
Gamblers like Averages and Sums! • The sum of 100 independent investments in risky companies is very predictable! • Sums (and averages) are more stable than the things summed (or averaged). • Square root law for variability of averages VAR -----> VAR/n
Example 4 - Industrial Quality Control • Filling Cereal Boxes, Oil Containers, Jam Jars • Labeled amount should be minimum • Save money if also maximum • variability reduction contributes to profit • Method: Management by exception …>
Management by exception QC = Quality Control <-- Nominal Amount
Japan a QC Innovator from 1950 • Consumer Reports • Best Maintenance History Almost all Japanese Makes • Worst Maintenance History American and European Makes Key Technology was Variability Reduction Usually via Control Charts
Summary Example 4 • Surprising that Simple Control Chart could have such influence • Control Chart is just an implementation of the idea of Management by Exception
Example 5 - A Simple Law of Life • Sometimes we see the same pattern in data from many different sources. • Recognition of patterns aids description, and also helps to identify anomalies
Example: Zipf’s Law • An empirical finding • Frequency * rank = constant • Example - frequency (i.e. population) of citiesLargest city is rank 1Second largest city is rank 2 ….
Population*Rank = Constant? (Frequency * rank = constant)
Other Applications of Zipf • Word Frequency in Natural or Programming Language • Volume of messages at Internet Sites • Number of Employees of Companies • Academic Publishing Productivity • Enrolment of Universities • …… • Google “Zipf’s Law” for more in-depth discussion
Summary for Zipf’s Law • Surprising that processes involving many accidents of history and social chaos, should result in a predictable relationship • Useful to describe an empirical relationship that has meaning in very different settings - a convenient descriptive tool.
Example 6 - Obtaining Confidential Information • How can you ask an individual for data on • Incomes • Illegal Drug use • Sex modes • …..Etc in a way that will get an honest response? There is a need to protect confidentiality of answers.
Example: Marijuana Usage • Randomized Response TechniquePose two Yes-No questions and have coin toss determine which is answeredHead 1. Do you use Marijuana regularly?Tail 2. Is your coin toss outcome a tail?
Randomized Response Technique • Suppose 60 of 100 answer Yes. Then about 50 are saying they have a tail. So 10 of the other 50 are users. 20%. • It is a way of using randomization to protect Privacy. Public Data banks have used this.
Summary of Example 6 • Surprising that people can be induced to provide sensitive information in public • The key technique is to make use of the predictability of certain empirical probabilities.
Example 7 - Survival Assessment • Personal Data is always hard to get. • Need to make careful use of minimal data • Here is an example ….
Traffic Accidents • Accident-Free Survival Time- can you get it from …. • Have you had an accident?How many months have you had your drivers license?
Accident Next Month Can show that, for my 2002 class of 100 students, chance of accident next month was about 1%.
Summary of Example 7 • Surprising that such minimal information is useful • Again, key technique is to use empirical probabilities and smoothing