Download
1 / 7
70 likes | 181 Vues
Learn how to choose marker shape, color, and size within GSS for analytes or samples in GWB applications. Import scatter data easily from GSS or text files, and view results in Gtplot or Xtplot. Create diagrams with Act2 or Tact, adjusting marker settings, labels, and connecting lines. GWB ensures automatic unit conversion in Gtplot and Xtplot, while Act2 and Tact require matching units in diagram axes.

E N D
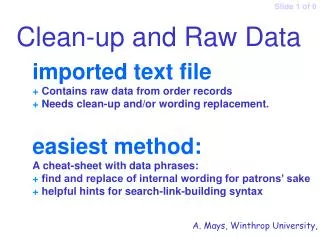
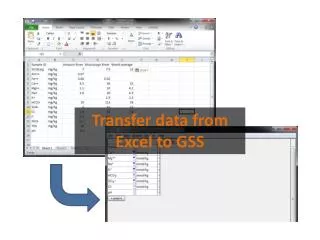
Choose marker shape, color, and size within GSS (by analyte or by sample). Enter species or component names as they appear in GWB apps, with units. GWB can import scatter data from GSS or from a formatted text file.
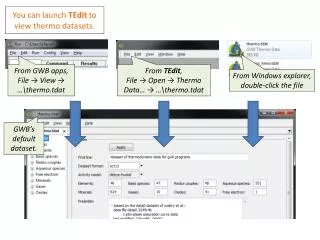
File → Open → Scatter Data... View plotted results in Gtplot or Xtplot, or create a diagram with Act2 or Tact.
You can also use drag-and-drop to add scatter data files from your desktop or Windows Explorer. Left-click and hold the icon, drag it into Gtplot, and drop.
Edit → GSS Data... Turn scatter data on or off, and choose marker symbol, color, and size by analyte or by sample. Include sample labels or legends and add connecting lines.
Scatter data units are converted automatically within Gtplot and Xtplot. For Act2 and Tact, units must match diagram axes.