(3 km)
Sand. Gravel. Clay. Cemented material. Measurement Techniques Borehole-based -- Shear- and compression-wave velocity profiles are readily developed Crosshole Measurements performed according to ASTM Standard

(3 km)
E N D
Presentation Transcript
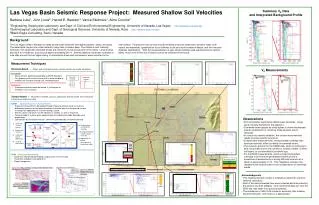
Sand Gravel Clay Cemented material • Measurement Techniques • Borehole-based -- Shear- and compression-wave velocity profiles are readily developed • Crosshole • Measurements performed according to ASTM Standard • Test geometry with shortest travel path is preferred due to tendency for refraction through stiff, cemented layers • Downhole • Preferred method for borehole-based VS testing due to refraction issues and cost • Surface-based -- VS profile is inverted, using an appropriate forward model, from measured surface wave dispersion data • SASW (Spectral Analysis of Surface Waves) • Dispersion characteristics developed through frequency-domain analysis of phase differences between vertical ground motions at discrete points on the ground surface resulting from application of a seismic energy source. • Seismic source signatures can be vibratory or random, as well as impulsive. • Forward model is a plane-wave approximation of fundamental-mode Rayleigh wave propagation. • Optimization by linearized inversion, sometimes preceded by simulated annealing Crosshole method Downhole method Soil profile • ReMi (Refraction Microtremor) • Dispersion relationship developed using passive seismic energy • Resolution to depths exceeding 50 m • Rapid, inexpensive Soil profile legend Uncemented Partially cemented Cemented Soil profile legend • Generate seismic energy • b) Collect time histories • Calculate phase difference • Unwrap phase data e) Combine data from different spacings f) Develop theoretical match through inversion g) Appropriate Vs profile corresponds to theoretical match 0 Soil profile #1 #2 30 m Soil profile Las Vegas Basin Seismic Response Project: Measured Shallow Soil Velocities Summary VS Data and Interpreted Background Profile Barbara Luke1, John Louie2, Harold E. Beeston3, Vance Skidmore1, Aline Concha2 1Engineering Geophysics Laboratory and Dept. of Civil and Environmental Engineering, University of Nevada, Las Vegas http://www.ce.unlv.edu/egl 2Seismological Laboratory and Dept. of Geological Sciences, University of Nevada, Reno http://www.seismo.unr.edu 3Black Eagle Consulting, Reno, Nevada Background The Las Vegas valley in Nevada is a deep alluvial basin filled with interlayered gravels, sands, and clays. The water table ranges from a few meters to many tens of meters deep. The climate is arid. Laterally extensive, thin carbonate-cemented lenses are commonly found across parts of the valley. Lenses range beyond 2 m in thickness, and occur at depths exceeding 200 m. Seismic datasets have been collected at nine sites around the Las Vegas valley, to characterize shear and compression wave velocities in the near surface. Purposes for the surveys include modeling of ground response to dynamic loads, both natural and manmade, quantification of soil stiffness to aid structural foundation design, and non-intrusive materials identification. With the recent adoption of new, stricter building code requirements for seismic safety, much more of this sort of data is sure to be collected in the future. VP Measurements CCSN (4.5 km) (1.5 km) SGS (0.05 km) (4 km) • Observations • Soil cementation significantly affects wave velocities. Large, abrupt velocity fluctuations are apparent. • Cemented layers appear as sharp spikes in downhole datasets and are problematic in crosshole measurements due to refraction. • In contrast to seismic refraction, the surface-wave methods readily process velocity inversions. • Surface wave measurements, having broader coverage than borehole methods, affirm continuity of cemented layers. • The inversion process for the SASW data, which is optimized to best incorporate known site conditions, reveals multiple, shallow, stiff layers, as corroborated by borehole logs. • For the ReMi measurements, which provide the broadest coverage of all, the more generalized shallow profile is sometimes characterized by a strong stiffness inversion at a depth of approximately 10 m. This impedance contrast may represents the vertical extent of the multiple layers of cemented media. (3 km) (3.5 km) (3 km) (2.5 km) Soil profile (1.5 km) Soil profile Numbers in parentheses are estimated depth to bedrock • Acknowledgments • This ongoing research project is funded by Lawrence Livermore National Laboratory. • Most of the data presented here were collected and interpreted by the authors and their affiliates. One commercial data set, from the SDSI site, was taken from public documents. • The assistance of UNLV EGL students, especially Gari Lindsey, Suzanne Newsom, and Ying Liu, is appreciated.