Download
1 / 26
270 likes | 432 Vues
A Vision for Florida’s Future: The 2030 Project. Current Realities. 11.1% unemployment 800,000+ jobs gone since February 2007 1 in 5 homes in foreclosure pipeline State Revenue shortfall $3.6 Billion Net Domestic Migration loss of 31,179. AWI, Mortgage Bankers Association, BEDR.

E N D
Current Realities 11.1% unemployment 800,000+ jobs gone since February 2007 1 in 5 homes in foreclosure pipeline State Revenue shortfall $3.6 Billion Net Domestic Migration loss of 31,179 AWI, Mortgage Bankers Association, BEDR www.FLFoundation.org
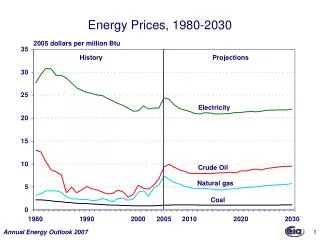
Florida Employment 8 million 8.01 m Mar 2007 Florida Total Employment 7.5million 7.37 m Jan 2004 7.23 m July 2010 7million 2010 2001 2002 2003 2004 2005 2006 2007 2008 2009 U.S. Bureau of Labor Statistics, Current Employment Statistics, August 2009 www.FLFoundation.org
Is the Florida We’ve Known Over? Is Florida the Sunset State? www.FLFoundation.org
Are We Ready for 2030? “Florida needs to plan better and grow smarter over the next 7 million people than we did during the last 7 million.” Steve Halverson, President & CEO, The Haskell Company& Immediate Past Chair of the Florida Chamber of Commerce www.FLFoundation.org
Florida’s New Change Management System Long Term Focus One Shared Agenda Metrics, Benchmarks & Accountability Coordination of efforts and resources www.FLFoundation.org
The 2030 Project A Common Vision A Common Framework Metrics for Accountability A “Bubble-Up” Process www.FLFoundation.org
The 2030 Project A Three-Part Vision Prosperity & High Paying Jobs Vibrant & Sustainable Communities Global Leadership www.FLFoundation.org
Scorecard: Measuring Florida’s Performance Just Like in Any Good Business, One Scorecard to Track Vital Signs www.TheFloridaScorecard.com www.FLFoundation.org
Talent Supply and Education Some Key Elements Early Learning Seamless Education (pre-k -20) STEM & Next Economy Skills Workforce Development Lifelong Learning Retirement Creative Class “Attractor” state 28.5 24.7 12.3 College Attainment (% of Population aged 25-64 with a bachelor’s degree or higher) High School Graduation (All diploma recipients including standard, special, and general equivalents) 21.8 89% 77.9% 81.1% 81.5% www.FLFoundation.org
Implications of Educational Achievement Unemployment Rate Median Earnings 4.4% $43,028 Bachelor's degree or higher 7.4% $31,910 Some college or Associate's degree 9.5% $25,629 High school diploma only 13.7% $18,851 Less than high school graduate AWI, March 2011; U.S. Census Bureau, American Community Survey, 2009; www.FLFoundation.org
Innovation & Economic Development Some Key Elements Entrepreneurism Research & Development Commercialization Venture $ Start ups & Incubation Economic Development Business Retention & Expansion Economic Gardening Global Trade & Investments Financial Markets Military & Homeland Security Food & Agriculture Tourism Starts Closings 663 511 477 592 109 95 Business Starts and Closings R&D (total per worker) Venture Capital (total per worker) 907 $206 $2,400 638 $795 $30 www.FLFoundation.org
Infrastructure & Growth Leadership Some Key Elements Transportation Trade Routes (Air, Land & Sea) Communications Energy Water Conservation Environment Sustainability Preparedness Energy Consumption 3rd Highest in US Fresh Water Consumption (gallons per day per person) 322.3 136.5 121.7 139.8 www.FLFoundation.org
Business Climate & Competitiveness Some Key Elements Cost of Doing Business Economic Efficiency Taxes Risk Management Property Rights Permitting Regulation Litigiousness Liability-Systems (national rank: 1 is best) Ranked 42nd Cost-of-Doing-Business 19th most expensive www.FLFoundation.org
Civic & Governance Systems Some Key Elements Term Limits Ethics & Elections Constitutional Amendments State & Local Governance Federalism Government Spending Courts & Legal System Regional Stewardship Civic Structure NGOs Civil Society 2010 Ballot Governor & Entire Cabinet US Senator 25 Congressional 23 of 40 State Senate 120 House Members Constitutional Amendments Local Initiatives www.FLFoundation.org
Quality of Life & Quality Places Some Key Elements Health, Wellness & Safety (Access, Quality & Affordability) Housing Rural & Urban Issues Family & Children Issues Equity & Diversity Poverty Arts, Culture & Preservation Recreation Sense of Place 235 171 158 7 Working Families in Poverty (national rank: 1=fewest) March 2011 Home Foreclosures Ranked 41st www.FLFoundation.org
State-of-the-Region: Florida’s Great Northwest www.FLFoundation.org
1.80 million 1.50 million 1.20 million 2009* 2000 2005 2015 2020 2025 2030 Still Growing, Only More Slowly 2009 = 1.4 million + 321,200 +194,708 1.2 million people in 2000 1.7 million people in 2030 BEBR Projections of Florida Population by County, 2008-2035 www.FLFoundation.org
Still Growing? Northwest Regional Population Growth Domestic Migration International Immigration 20 K Natural Increase 10 K 0 - 2 k 2000 2001 2002 2003 2004 2005 2006 2007 2008 Florida Bureau of Economic and Business Research, Population Estimates, April 2009 & US Census Bureau, Components of Population Change www.FLFoundation.org
Maintaining Wealth Gains? Increase in Personal Income Per Capita 1999 personal income per capita 2008 personal income per capita Source: US Census, FedStats www.FLFoundation.org
Six Pillars Caucus System Overall Objectives • Establish a continuous source for insight and feedback related to economic trends, societal needs, gaps and events • Construct a strategic plan for the year 2030 to help guide Florida towards a future economy that includes high-wage jobs, global competitiveness and vibrant communities • Interim goals for 2015: provide feedback and insights for Governor Rick Scott’s 7-7-7 Plan www.FLFoundation.org
Six Pillars Caucus System Steering Committee Caucus Members At-Large Members www.FLFoundation.org
Regional / Local Six Pillars Executive Committee Task Force Members Local Constituents www.FLFoundation.org
Cornerstone 2030—The Plan A Common Vision A Common Framework Metrics for Accountability A “Bubble-Up” Process For more information on becoming a Six Pillars Community, contact Stephanie Gibbons at sgibbons@FLFoundation.org or 850-521-1253 www.FLFoundation.org