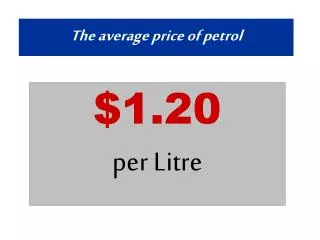
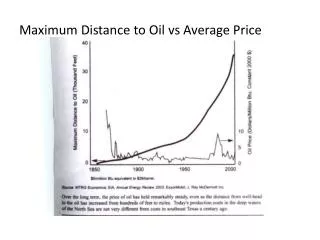
Maximum Distance to Oil vs Average Price
710 likes | 951 Vues
Maximum Distance to Oil vs Average Price. Maximum Efficiency of Prime Movers. Energy Density of Primary Fuels. Power Density . Crude Oil Production. Natural Gas Production. Annual Energy Consumption in England and Wales per capita by type.

Maximum Distance to Oil vs Average Price
E N D
Presentation Transcript
Annual Energy Consumption in England and Wales per capita by type
Annual Energy Consumption in England and Wales per capita by type
Twentieth Century Gains in Energy Efficiency: Fossil Fuel Plants
Twentieth Century Gains in Energy Efficiency: Aircraft Engines
Twentieth Century Gains in Energy Efficiency: Ammonia Synthesis
World liquid fuels consumption, GDP, and WTI crude oil prices
Crude oil prices and key geopolitical and economic events 1: US spare capacity exhausted 2: Arab Oil Embargo 3: Iranian Revolution 4: Iran-Iraq War 5: Saudis abandon swing producer role 6: Iraq invades Kuwait 7: Asian financial crisis 8: OPEC cuts production targets 1.7 mmbpd 9: 9-11 attacks 10: Low spare capacity 11: Global financial collapse 12: OPEC cuts production targets 4.2 mmbpd
Rising oil prices held down global oil consumption growth from2005-2008, despite high economic growth
Average daily open interest in crude oil futures on U.S. exchanges
U.S. exchange-traded short positions by physical participants consistently exceed longs