Download
1 / 1
10 likes | 115 Vues
0. 0. 0. 0. LAI. LAI. LAI. LAI. 6. 4. 5. 5. Needleaf Forest. Needleaf Forest. Broadleaf Forest. Broadleaf Forest. Crops. Crops. Pasture/Grasses. Pasture/Grasses. Tundra/Barren. Tundra/Barren. -4. -4. 2. 2. 4. 4. -2. -2. 0. 0. LAI Difference. LAI Difference.

E N D
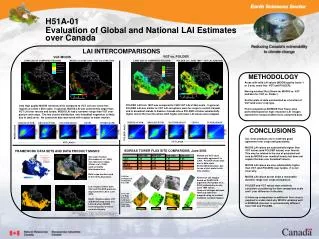
0 0 0 0 LAI LAI LAI LAI 6 4 5 5 Needleaf Forest Needleaf Forest Broadleaf Forest Broadleaf Forest Crops Crops Pasture/Grasses Pasture/Grasses Tundra/Barren Tundra/Barren -4 -4 2 2 4 4 -2 -2 0 0 LAI Difference LAI Difference MODIS LAIx20 POLDER LAIx20 VGT LAIx20 VGT LAIx20 H51A-01 Evaluation of Global and National LAI Estimates over Canada LAI INTERCOMPARISONS VGT vs. POLDER VGT-MODIS LAND USE OF COMPARED REGIONS MODIS LAI JUNE 2000 – VGT LAI JUNE 2000 LAND USE OF COMPARED REGIONS POLDER LAI JUNE 1997 – VGT LAI JUNE1998 METHODOLOGY Areas with valid LAI values (MODIS quality levels 1 or 2 only, snow free VGT and POLDER). Moving window filter (5kmm for MODIS vs. VGT and 9km for VGT vs. Polder ). Scatter plots of data summarized as a function of VGT land cover crop type. Point evaluation at BOREAS Flux Tower sites performed based on high resolution LAI images adjusted for temporal differences using field data. LEAF AREA INDEX JUNE 1997 POLDER LAI from 1997 was compared to 1998 VGT LAI at 9km scale. In general, POLDER LAI was similar to VGT LAI exceptions were for crops in central Canada and in broadleaf stands in Eastern Canada where POLDER LAI was substantially higher and at the tree line where both higher and lower LAI values were mapped. Only high quality MODIS retrievals were compared to VGT LAI over snow free regions at a 5km x 5km scale. In general, MODIS LAI was consistently larger than VGT LAI over forests and tundra. MODIS LAI had a narrower range than VGT over pasture and crops. The two cluster distribution over broadleaf vegetation is likely due to land cover. No consistent bias was noted with respect to water fraction. NEEDLEAF FOR. BROADLEF FOR. PASTURE/GRASS CROPS TUNDRA/BARE NEEDLEAF FOR. BROADLEF FOR. PASTURE/GRASS CROPS TUNDRA/BARE CONCLUSIONS ALL three products are in relatively good agreement over crops and grasslands. MODIS LAI values are substantially higher than VGT values (and POLDER values) over forests. This may be related to the use of projected leaf area by MODIS over needleaf forests but does not explain the bias over broadleaf forests. MODIS LAI values are also substantially higher than VGT (and POLDER) over tundra. It is not clear why. MODIS LAI values do not show a reasonable dynamic range over crops and pasture. POLDER and VGT values were relatively consistent considering the 9km comparison scale and 1 year difference in the data. A follow-up comparison to additional field sites is required to understand why MODIS validates well at BOREAS sites but is systematically different from VGT and POLDER. BOREAS TOWER FLUX SITE COMPARIONS, June 2000 FRAMEWORK DATA SETS AND DATA PRODUCT MASKS LEAF AREA INDEX 1993 Baseline Year MODIS and VGT show reasonable agreement to CASI. POLDER shows bias due to 6km scale. ECOCLIM shows bias due to use of plot scale in-situ data LAImax. 1km water fraction (Fernandes et. al., 2000) 1km land cover maps (Cihlar et al., 2000) used to stratify Intercomparions. Both maps are also used In the VGT LAI product. CASI 2m multispectral composites Feb. 1994 Reference LAI images based on FLIM-CLUS algorithm (Fernandes et al., 2003) calibrated to in-situ June 1994 values. Temporal changes between 1994 and 2000 were mapped using co-incident multidate Landsat imagery. Fernandes, R. A., J. R. Miller, J. M. Chen, and I. G. Rubinstein, 2004. Evaluating Image Based Estimates of Leaf Area Index in Boreal Conifer Stands over a Range of Scales using High-Resolution CASI Imagery. Remote Sensing of Environment 89:200-216. Left: Regions where both VGT and POLDER products map snow free LAI in June 2000. Right: Regions where VGT and MODIS map snow free LAI and where MODIS retrieval quality is first or second category. June, 200 LAI Maps Based on CASI data and Landsat Data from 1994, 2000 Fernandes, R.A., Pavlic, G., 2000, Waterbody Fraction Map of Canada, available via www.geogratis.ca Cihlar J. , Latifovic R. , Beaubien J. , Guindon B. , Palmer M., 2003, Thematic mapper (TM) based accuracy assessment of a land cover product for Canada derived from SPOT VEGETATION (VGT) data; Canadian Journal of Remote Sensing , Vol. 29, pp. 154-170