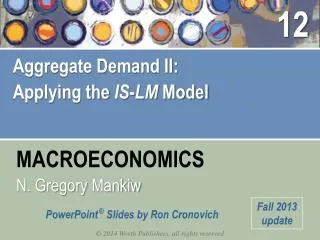
Aggregate Demand II: Applying the IS - LM Model
1.12k likes | 1.78k Vues
Aggregate Demand II: Applying the IS - LM Model. Chapter 12 of Macroeconomics , 8 th edition, by N. Gregory Mankiw ECO62 Udayan Roy. Applying the IS-LM Model.

Aggregate Demand II: Applying the IS - LM Model
E N D
Presentation Transcript
Aggregate Demand II: Applying the IS-LM Model Chapter 12 of Macroeconomics, 8thedition, by N. Gregory Mankiw ECO62UdayanRoy
Applying the IS-LM Model • Section 12-1 shows how the IS-LM model that we studied in Chapter 11 can be applied to understand how an economy copes with disturbances (or, shocks) in the short run • Section 12-3 extends section 12-1 by looking closely at • The Great Depression of the 1930s, and • The Great recession of 2008-09 • Warning: I will skip section 12-2! Very sorry!
The IS-LM Model: Ch. 11 Assumptions • Y = C + I + G • C = Co + Cy✕ (Y – T) • I = Io−Irr • G and T are exogenous • M = Md = L(i) ✕ P ✕ Y • L(i) = Lo – Li ✕ i • i = r + Eπ • M, P and Eπ are exogenous
The IS-LM Model: Ch. 11 Summary • Y = C + I + G • C = Co + Cy✕ (Y – T) • I = Io−Irr • G and T are exogenous • M = Md = L(i) ✕ P ✕ Y • L(i) = Lo – Li ✕ i • i = r + Eπ • M, P and Eπ are exogenous
LM r IS Y The IS-LM Model: Ch. 11 Summary • Short-run equilibrium in the goods market is represented by a downward-slopingIS curve linking Y and r. • Short-run equilibrium in the money market is represented by an upward-slopingLM curve linking Y and r. • The intersection of the IS and LM curves determine the short-run equilibrium values of Y and r. • The IS curve shifts right if there is: • an increase in Co + Io + G, or • a decrease in T. • The LM curve shifts right if: • M/P or Eπ increases, or • Lo decreases
LM r IS Y Equilibrium in the IS-LMmodel The IScurve represents equilibrium in the goods market. r1 The LMcurve represents money market equilibrium. Y1
Shifts of the IS curve r • Recall from Chapter 11 that • the consumption function is C(Y – T) = Co + Cy✕ (Y – T), and • The investment function is I(r) = Io – Ir✕ r • Recall also that the IS curve shifts right if there is: • an increase in Co + Io + G, or • a decrease in T. • As a result, both Y and rincrease LM r1 IS Y Y1
Shifts of the IS curve r • Similarly, the IS curve shifts left if there is: • a decrease in Co + Io + G, or • an increase in T. • As a result, both Y and rdecrease LM r1 IS Y Y1
Shifts of the IS curve r • In other words, we can make the following predictions: LM r1 IS Y Y1
Ch. 11: Comparing fiscal policy in the Keynesian Cross and in the IS Curve In the Keynesian Cross model, expansionary fiscal policy boosts GDP by an amount dictated by the multipliers. Keynesian Cross K.C. Tax-Cut Multiplier K.C. Spending Multiplier In the IS-LM model, expansionary fiscal policy also raises the real interest rate, thereby weakening the effect of fiscal policy on GDP. (Crowding-out effect) IS Curve
Fiscal Policy is Weakened by the Crowding-Out Effect • We have just seen that, in the IS-LM model, expansionary fiscal policy (G↑ or T↓) • leads to higher interest rates, which • exerts downward pressure on investment spending, which • exerts downward pressure on GDP and jobs. • This negative aspect of expansionary fiscal policy is called the crowding-out effect • This effect was absent in the Keynesian Cross model • Thus, fiscal policy is less effective in the IS-LM model than in the Keynesian Cross model
LM r r2 r1 IS2 IS1 Y1 Y2 Y 2. 1. 3. An increase in government purchases: graph 1. IS curve shifts right causing GDP to rise. 2. This raises money demand, causing the interest rate to rise… 3. …which reduces investment, so the final increase in Y
LM r r2 1. 2. r1 1. IS2 IS1 Y1 Y2 Y 2. 2. A tax cut Consumers save (1MPC) of the tax cut, so the initial boost in spending is smaller for T than for an equal G… and the IS curve shifts by …so the effects on rand Y are smaller for T than for an equal G.
Shifts of the LM curve r LM r1 IS Y Y1
Shifts of the LM curve r • Similarly, the LM curve shifts left if there is: • a decrease in M/P or Eπ, or • an increase in Lo. • As a result, Ydecreases and rincreases LM r1 IS Y Y1
Shifts of the LM curve r • Recall from Ch. 11 that, if expected inflation (Eπ) increases (decreases), the LM curve shifts down (up) by the exact same amount! • Therefore, if Eπdecreases, r will increase, but by a smaller amount. • Therefore, i = r + Eπ will decrease. LM r1 IS Y Y1
IS-LM Predictions At this point, you should be able to do problems 1, 2, 3 (a) – (f), 4, and 5 on pages 352 – 353 of the textbook. Please try them.
Monetary Policy • The practice of changing the quantity of money (M) in order to affect the macroeconomic outcome is called monetary policy • an increase in the quantity of money (M↑) is called expansionary monetary policy, and • A decrease in the quantity of money (M↓) is called contractionary monetary policy
Shifts of the LM curve r • When the central bank of a country makes changes to the quantity of money (M), • only the LM curve changes, and • the real interest rate (r) changes in the opposite direction • As expected inflation (Eπ) is assumed exogenous in the IS-LM model, when the real interest rate (r) changes, the nominal interest rate (i = r + Eπ) changes in the same direction. LM r1 IS Y Y1
Shifts of the LM curve r • One can think of the central bank as • targeting M and affecting r and i in the process, or as • targeting r and/or i and adjusting M to achieve the target LM r1 IS Y Y1
Monetary Policy Re-defined • Therefore, one can re-define expansionary and contractionary monetary policy as follows: • Monetary policy is expansionary when the central bank attempts to reduce interest rates (real and nominal), and • Monetary policy is contractionary when the central bank attempts to increase the interest rates (real and nominal)
The Federal Funds Rate • In the United States, the central bank (the Federal Reserve) formally describes its monetary policy by periodically announcing its desired or target level for a nominal interest rate called the Federal Funds Rate • Having announced its target level for the FFR, the Fed then adjusts the money supply to steer the actual FFR as close to its target level as it can
The Federal Funds Rate • The Federal Funds Rate is the interest rate that banks charge each other for overnight loans • If the Fed wishes the FFR to be 1.8%, all it has to do is to announce that • it will lend money to any bank at 1.8% interest and • will pay 1.8% interest on deposits received from any bank
The Federal Funds Rate • Given that the Fed expresses its monetary policy in terms of the target value of the Federal Funds Rate, we can re-define monetary policy as follows: • Monetary policy is expansionary when the Fed seeks to reduce the federal funds rate, and • Monetary policy is contractionary when the Fed seeks to increase the federal funds rate • Keep in mind that, when expected inflation (Eπ) is exogenous, changes in nominal interest rates (such as the FFR) lead to equal changes in real interest rates
The Zero Lower Bound on Nominal Interest Rates r • We have seen that, when faced with a recession, the central bank can • Increase the money supply (M↑) • Thereby shifting the LM curve right • Thereby reducing the real interest rate (r = i−Eπ ↓) and the nominal interest rate (i = r + Eπ↓) and increasing GDP (Y↑) to drag the economy out of the recession LM r1 IS Y Y1
The Zero Lower Bound on Nominal Interest Rates r • The problem is that there is a limit to how low the nominal interest rate can be • Nominal interest rates (such as the federal funds rate) cannot be negative • To deal with the 2008 economic crisis, the Fed reduced the FFR to zero • But the recession persisted • Unfortunately, the Fed could not reduce interest rates below zero: monetary policy had reached its limit LM r1 IS Y Y1
The Zero Lower Bound on Nominal Interest Rates: Crisis 2008-09
The Zero Lower Bound on Nominal Interest Rates r • r = i−Eπ • iminimum = 0 • Therefore, rminimum = iminimum−Eπ = 0 −Eπ • Therefore, rminimum = −Eπ • For example, if Eπ = −3%, then rminimum = −Eπ = 3% LM r1 2.1% IS Y Y1
The Zero Lower Bound on Nominal Interest Rates r • For example, in the diagram, the central bank will have to reduce the real interest rate to r = 2.1% in order to end the recession • But suppose expected inflation is Eπ = − 3% • Then, the nominal interest rate would have to be brought down to i = r + Eπ = 2.1 – 3.0 = – 0.9% • Which, alas, is impossible LM r1 2.1% IS Y Y1 This example also shows how dangerous it can be if we have deflation and people begin to expect the deflation to continue
The Zero Lower Bound on Nominal Interest Rates • If the nominal interest rate has been reduced all the way down to zero, and the economy is still stuck in a recession, the economy is said to be • at the zero lower bound, or • in a liquidity trap • See page 350 of the textbook
The Zero Lower Bound on Nominal Interest Rates: Solutions • When an economy is in a liquidity trap, monetary policy cannot be used to reduce interest rates any further • But is there nothing else that can be done to bring the economy back to life? • Yes, there is! • Expansionary fiscal policy can be used • And there’s something else that the monetary authorities (the central bank) can do: make a credible promise to be irresponsible!
The Zero Lower Bound on Nominal Interest Rates: Solutions r • In my example, • the central bank needs to reduce the real interest rate to r = 2.1% to end the recession • But expected inflation is Eπ = − 3% • So, the nominal interest rate would have to be brought down to i= – 0.9%, which, alas, is impossible • Recall that the LM curve shifts right if either M or Eπ increases • If the central bank promises to be irresponsible and to create rapid inflation in the future, and if people believe its promise, then Eπ will increase, say from − 3% to +1% • Then the nominal interest rate required for full-employment will be i = r + Eπ = 2.1 + 1.0 = 3.1%, which is definitely attainable LM r1 2.1% IS Y Y1 The zero-lower-bound problem can be solved if the central bank can credibly promise to be irresponsible!
The Zero Lower Bound on Nominal Interest Rates: Solutions • Although this chapter assumes a closed economy, in reality foreign trade does matter. • So, the central bank can • print domestic currency, and • use it to buy foreign currency, • thereby making the domestic currency cheaper relative to the foreign currency, • thereby stimulating exports, • thereby ending the recession!
The Zero Lower Bound on Nominal Interest Rates: Solutions • Even when short-term interest rates such as the federal funds rate are at zero percent, the central bank can print money and make long-term loans to the government, to businesses, to home-buyers who need mortgages, etc. • This would reduce long-term interest rates directly, thereby stimulating spending by the borrowers • This strategy—called quantitative easing—may also end a recession
Interaction between monetary and fiscal policy • IS-LM Model: Monetary and fiscal policy variables (M, G, and T) are exogenous. • Real world: Monetary policymakers may adjust Min response to changes in fiscal policy, or vice versa. • Such responses by the central bank may affect the effectiveness of fiscal policy
The Fed’s response to G > 0 • Suppose the government increases G. • Possible Fed responses: 1.hold M constant 2.hold r constant 3.hold Y constant • In each case, the effects of G on Yare different…
LM r r2 r1 IS2 IS1 Y1 Y2 Y Response 1: Hold M constant When G increases, the IS curve shifts right. If Fed holds M constant, then LM curve does not shift. As a result, interest rates rise. This has a crowding-out effect. Consequently, GDP increases, but not a lot.
LM1 r LM2 IS2 IS1 Y3 Y1 Y2 Y Response 2: Hold r constant If Congress raises G, the IScurve shifts right. To keep r constant, Fed increases Mto shift LM curve right. r2 r1 Results:
LM2 LM1 r r3 r1 IS2 IS1 Y1 Y2 Y Response 3: Hold Y constant If Congress raises G, the IScurve shifts right. To keep Y constant, Fed reduces Mto shift LM curve left. r2 Results: At this point, you should be able to do problem 7 on page 353 of the textbook. Please try it.
Estimates of fiscal policy multipliers from the DRI macroeconometric model Estimated value of Y/G Estimated value of Y/T Assumption about monetary policy Fed holds money supply constant 0.60 0.26 Fed holds nominal interest rate constant 1.93 1.19 A macroeconometric model is a more elaborate version of our IS-LM model, with the parameters given the numerical values that they are estimated to have, based on historical data.
Shocks in the IS-LM model IS shocks: exogenous changes in the demand for goods & services. Examples: • stock market boom or crash change in households’ wealth C • change in business or consumer confidence or expectations I and/or C
Shocks in the IS-LM model LM shocks: exogenous changes in the demand for money. Examples: • a wave of credit card fraud increases demand for money. • more ATMs or the Internet reduce money demand.
NOW YOU TRY: Analyze shocks with the IS-LMModel Use the IS-LM model to analyze the effects of 1.a boom in the stock market that makes consumers wealthier. 2.after a wave of credit card fraud, consumers using cash more frequently in transactions. For each shock, a.use the IS-LM diagram to show the effects of the shock on Y and r. b.determine what happens to C, I, and the unemployment rate.
The U.S. Recession of 2001 • 3.9% on 9/00 • 4.9% on 8/01 • 6.3% on 6/03 • 5.0% on 7/05
The U.S. Recession of 2001 • Growth of GDP was negative in the 1st and 3rd quarters of 2001 • That’s essentially before 9/11
The U.S. Recession of 2001 r • Why? • Demand shocks moved the IS curve left • The “tech bubble” ended and stocks fell 25% between 8/00 and 8/01 • 9/11 attacks led to a 12% fall in stock prices in one week and a huge rise in uncertainty • Scandals at Enron, WorldCom and other corporations led to stock price declines and a decline in trust and a rise in uncertainty • Lower household wealth reduced Co and higher uncertainty reduced Io LM r1 IS Y Y1
1500 Standard & Poor’s 500 1200 Index (1942 = 100) 900 600 300 1995 1996 1997 1998 1999 2000 2001 2002 2003 CASE STUDY: The U.S. recession of 2001 Causes: 1) Stock market decline C