Download
1 / 2
20 likes | 128 Vues
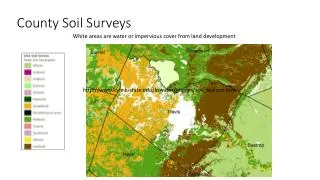
This resource focuses on soil surveys in various counties, particularly highlighting white areas affected by water and impervious surfaces due to land development. It explains soil texture classification using the Soil Texture Triangle, demonstrating how a soil composed of 56% sand, 20% silt, and 24% clay is categorized as sandy clay loam. Additionally, it provides insights into how different soil textures can influence water retention and land use practices.

E N D
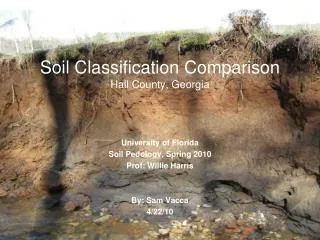
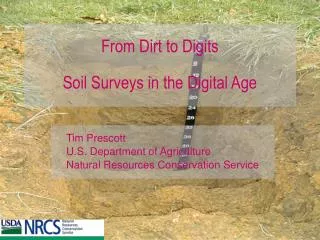
County Soil Surveys White areas are water or impervious cover from land development http://www.ksre.k-state.edu/kswater/images/soil_texture.htm
Soil Texture Triangle A soil with 56% sand, 20% silt and 24% clay is a sandy clay loam 20% silt Silt Clay Sand 24% clay 56% sand http://www.ksre.k-state.edu/kswater/images/soil_texture.htm