Download
1 / 43
450 likes | 709 Vues
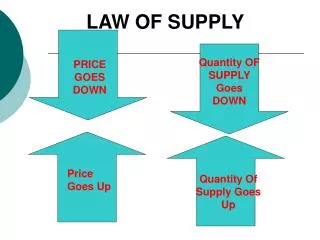
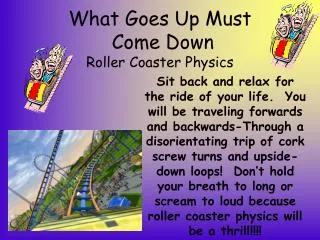
What goes UP must come DOWN The mathematics of tide prediction. Rex Boggs, Glenmore State High School Kiddy Bolger, The Rockhampton Grammar School. Tides are defined as “ The periodic rise and fall of … water resulting from gravitational interactions between the Sun, Moon, and Earth .”.

E N D
What goes UP must come DOWNThe mathematics of tide prediction Rex Boggs, Glenmore State High SchoolKiddy Bolger, The Rockhampton Grammar School
Tides are defined as “The periodic rise and fall of … water resulting from gravitational interactions between the Sun, Moon, and Earth.”
A model for tide height often used in the classroom is a sine function of the form
But actual tides are much more complex than a simple sine function.
The modern method used to generate an accurate mathematical model for tides is called harmonic analysis.The model generated by harmonic analysis is a sum of cosine terms, plus a constant.
The “tide function” for a given port typically has upwards of twenty cosine terms.Each cosine term is called a harmonic constituent. The constant term Z0 is called the chart datum and is the base from which tides are measured.
Until 1965, tide heights were calculated by machinessimilar to this onedesigned by Sir William Thomson in 1873.
The photo shows one such machine for calculating tides. In the mid-1960s, these machines, were replaced by computers.
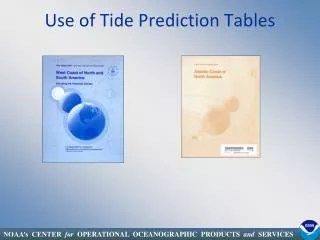
Consider the tides at Mooloolaba on January 1, 2002. Here are the data from the Official Tide Tables and Boating Safety Guide, 2002: We wish to develop a mathematical model that accurately predicts these tide heights.
Moon Earth Our first tidal model will use onlyone harmonic constituent, M2, which is the gravitational influence of the Moon. This is the constituent with the greatest influence on the tides.
From the Australian National Tide Tables for 2002, we obtain the following information for Mooloolaba on 1 Jan2002: Chart datum for Mooloolaba is 0.94 metres.
Substituting into the tide function gives us our first model for the tides at Mooloolaba on 1 January 2002: Note that the formulas for tide prediction are in degrees (and not radians)
Here is the graph of our model over a twenty-four hour period. This model predicts a low tide of 0.336 metres at 3:19 a.m., while the tide tables show a low tide of 0.06 m at 2:43 a.m. Our model needs a bit of refinement!
The next most important constituent is S2, the gravitational influence of the Sun. At new moon and full moon, the Sun and the Moon combine to give larger tides.
In the first quarter and third quarter, the Sun and the Moon are pulling at right angles to each other, resulting in smaller tides.
This diagram nicely shows the effect on the tide height of the different phases of the moon over a thirty-day period.
From the Australian National Tide Tables for 2002, we obtain the following information for Mooloolaba on 1 Jan2002:
Here is the 24 hour graph: This model predicts a low tide of 0.219 metres (compared to 0.06) at 3:09 a.m. (compared to 2:48 a.m.).
This is a better model, but still not sufficiently accurate. We haven’t yet accounted for the fact that successive high tides usually are not equal.
In Mooloolaba on 1 January 2002, the high tides differ by 0.72 metre, and the low tides differ by 0.23 metres. Such differences are a common occurrence at mid-latitudes. The high tides differ by 0.72 m
Moon B A Earth This is largely caused by the declination of the moon (i.e. the angle of the moon above or below the equator).
Moon B A Earth A person at A would experience a relatively high tide. Slightly more than twelve hours later, the person would be at B (due to the rotation of the Earth) and the tide would be smaller.
This is called a diurnal effect, since its period is approximately one day. There are two harmonic constituents needed to account for this, called K1 and O1.
Including these constituents gives us the following model for tide height:
Here is the graph of this function: This model predicts a low tide of 0.05 metres (compared to 0.06) at 2:41 a.m. (compared to 2:48 a.m.).
The model also predicts a high tide of 2.02 metres (compared to 2.03) at 9:30 a.m. (compared to 9:29 a.m.).
The tide model, using only four harmonic constituents, has an error of less than 1% for both time and height !
For each port in Australia, the tide models constructed at the National Tidal Facility at Flinders University typically include over twenty constituents. It is interesting to learn that tide models based solely on the four constituents M2, S2, K1 and O1 will have a maximum error in both height and time of no more than 5% (and often much less than that).
The presenters wish to thank Mike Davis from the National Tidal Facility at Flinders University and Captain Arthur Diack from the Maritime Division of Queensland Transport for their technical assistance in the developmentof this presentation.
Appendix A A more general model for tide prediction
The “tide function” given earlier was a simplified version of the more general model so each constituent has the form
The amplitude of each constituent is actually the product of two factors, H and F. H is the base amplitude. Determining this value requires observations to be taken over many years.
The amplitude of each constituent is actually the product of two factors, H and F. F is a slowly varying function, having a period of about nineteen years. This function is based on the precession of the plane of the Moon’s orbit, which has a period of about 18.6 years.,
The phase angle has two components, g and A, which are added together. g depends only on the site at which the observations are made. A is the phase of the constituent at Greenwich when t = 0 (i.e. at midnight).
In summary: • The values of Z0, H and g depend only upon the port. Values for each Standard Port are given in Table II of the National Tide Tables. • The values of A and F for the four main constituents depend only upon time. Values for each day of the year are given in Table III of the National Tide Tables.
As an example, here are the calculations for the M2 constituent at Mooloolaba on 1 January 2002. From the Australian National Tide Tables H for Mooloolaba is 0.539 F on 1 January 2002 was 1.12 Multiplying these factors gives 0.60368, which was the amplitude given previously.
From the Australian National Tide Tables g for Mooloolaba is 234.9 A on 1 January 2002 was 041 Adding these factors gives 275.9, which was the phase angle given previously for the M2 constituent.
Appendix B Further information about tides
Moon A B Earth Now a bit more about tides. This diagram show why successive tides at the equator tend to be a similar height.
Moon A B Earth This diagram show why there tends to be only one high tide per day at higher latitudes. At B, the tide is negligible.
Not all tides are semi-diurnal. Here are 30-day tide charts from other parts of the world.
These diagrams show why typically there are two high tides per day. One is caused by the gravitational attraction of the moon, whilst the other is due to centrifugal force caused by the rotation of the Earth/Moon combination about their centre of gravity.