Download
1 / 1
10 likes | 174 Vues
Abstr. M39. Relationship of gestation length to stillbirth R.L. Powell,* H.D. Norman, J.R. Wright Animal Improvement Programs Laboratory, Agricultural Research Service, USDA, Beltsville, MD 20705-2350. RESULTS (cont.). RESULTS (cont.). DATA & METHODS (cont.) Model :

E N D
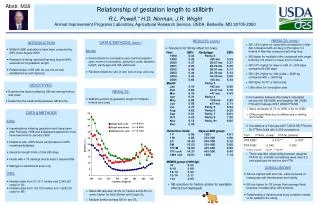
Abstr. M39 Relationship of gestation length to stillbirth R.L. Powell,* H.D. Norman, J.R. Wright Animal Improvement Programs Laboratory, Agricultural Research Service, USDA, Beltsville, MD 20705-2350 RESULTS (cont.) RESULTS (cont.) DATA & METHODS (cont.) Model: • Fixed effects for conception year, herd-conception year, month of conception, parturition code, lactation length, parity-age and milk yield level. • Random effects for sire of calf, sire of cow, and cow. INTRODUCTION Stillbirth (SB) evaluations have been computed by AIPL since August 2006. Research is being reported that may lead to AIPL evaluations for gestation length. Relationships of SB with GL are not as well established as with dystocia. • SB 1.5% higher for cows with conceptions in Mar-Apr compared with Jul-Aug; 4.3% higher for heifers in Mar-Apr compared with Aug-Sep • SB higher for multiple births compared with single births by 3.5 times for cows; 2.3 for heifers. • SB 2.0% higher for days in milk of > 500 days compared to 250 days • SB 1.5% higher for milk yields < 6000 kg compared with > 16000 kg • SB higher for 5th or later parity • Little effect for conception year Solutions for SB by effect for cows Year:SB% Parity/age: SB% 1998 5.43 Parity 2 1999 5.42 <26 mo 5.53 2000 5.37 26-27 mo 5.37 2001 5.26 28-29 mo 5.25 2002 5.43 30-31 mo 5.17 2003 5.44 32-33 mo 5.13 2004 5.45 34-35 mo 5.09 2005 5.66 >35 mo 5.34 Month: Parity 3 Jan 5.19 <42 mo 5.06 Feb 5.82 42-47 mo 5.16 Mar 6.19 >47 mo 5.44 Apr 6.31 Parity 4 May 5.88 56 mo 5.35 Jun 5.09 57 mo 5.71 Jul 4.79 Parity 5 5.93 Aug 4.62 Parity 6 6.20 Sep 5.01 Parity 7 6.61 Oct 5.22 Parity 8 7.32 Nov 5.12 Parity 9+ 6.85 Dec 5.29 Parturition Code: Days-in-Milk group: 1 F 5.06 <251 4.91 1 M 4.68 251-300 4.86 2 F 16.42 301-350 5.12 2M 15.52 351-400 5.60 1F/1M 18.92 401-450 6.02 1F/1 unk 14.31 451-500 6.40 1M/1 unk 16.91 >500 7.14 MEMilk group (1000 kg): <8 6.45 8-10 5.80 10-12 5.43 12-14 5.17 >14 4.93 OBJECTIVES Examine the factors affecting SB rate among heifers and cows. Determine the relationship between SB and GL. RESULTS • Stillbirth percent by gestation length for Holstein heifers and cows • Correlations between this study’s calculated service sire SB (SSB) and daughter SB (DSB) PTA with February 2007 USDA PTA SB • Were moderate (0.73 for SSB, 0.63 for DSB). • Differences likely due to differences in editing and model. DATA & METHODS Edits: • Inseminations initiating gestation must have been after February 1998 and subsequent parturition must have been before January 2006 • Holsteins with >86% breed purity based on AIPL crossbred database • Gestation length limits of 260-295 days • Herds with ≥ 15 calvings and at least 3 reported SB • Matings to identified AI sires only Data: • Holstein data from 311,511 heifers and 5,245,251 cows for GL. • Holstein data from 136,723 heifers and 1,228,270 cows for SB. (r = -0.037) (r = -0.004) (r = -0.128) • Correlations of February 2007 USDA SB PTA with GL PTA for bulls with ≥300 conceptions Trait PTA GL (cows) PTA GL(heifers) PTA SSB1 0.212*** 0.193** PTA DSB1 0.045 0.035 1Includes all parities ** p<.01 *** p<.001 • There was little relationship between daughter PTA for GL and SB; correlations were near 0.2 and significant for service sire PTA. CONCLUSIONS SB are highest with short GL, likely because of inadequate calf development and vitality. SB are higher for GL longer than average likely because of relationship with dystocia. Relationship of dystocia and body condition needs to be added to the study. • SB solutions for heifers similar for available effects (not displayed) • Mean SB rate was 12.3% for heifers and 5.4% for cows; higher for both shorter and longer GL. • Multiple births increase SB for any GL.