
Uploaded by
mirari
3 SLIDES
151 VUES
30LIKES
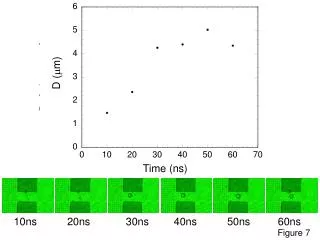
Time Analysis of Signal Delay Across Different Nanosecond Intervals
DESCRIPTION
This study presents a detailed analysis of signal delays measured at different nanosecond intervals (10ns, 20ns, 30ns, 40ns, 50ns, and 60ns). The figures illustrate the trends observed in signal performance over time, highlighting the effects of increasing delay on system behavior. Figures 7, 8, and 9 each represent testing results at specified intervals, providing insights into time-related challenges in electronic systems. The findings are crucial for understanding signal integrity and timing in high-speed circuits.
Download
1 / 3
Download Presentation

Télécharger la présentation
Time Analysis of Signal Delay Across Different Nanosecond Intervals
An Image/Link below is provided (as is) to download presentation
Download Policy: Content on the Website is provided to you AS IS for your information and personal use and may not be sold / licensed / shared on other websites without getting consent from its author.
Content is provided to you AS IS for your information and personal use only.
Download presentation by click this link.
While downloading, if for some reason you are not able to download a presentation, the publisher may have deleted the file from their server.
During download, if you can't get a presentation, the file might be deleted by the publisher.
E N D
More Related
Audio
Live Player