Download

1 / 61
790 likes | 2.11k Vues
Portfolio Theory Capital Market Theory Capital Asset Pricing Model. “ Do not put all your eggs in one basket. Expected Returns. Expected return: average return on a risky asset expected in the future . where: P i = probability of each state of the economy

E N D
Portfolio Theory Capital Market TheoryCapital Asset Pricing Model “Do not put all your eggs in one basket
Expected Returns Expected return: average return on a risky asset expected in the future. where: Pi = probability of each state of the economy Ri = expected return under each state and Risk premium = E ( R ) - Rf = Expected return – Risk free rate
Standard Deviation Standard deviation is calculated as: where: Pi = probability of each state of the economy Ri = expected return under each state E(R) = expected return for the security
Example; Stock A gives average return 4% on the normal situation. During the crisis,Stock A plumped and generated negative return -2%. However,Stock A expected to generate return 10% on bullish economy. Given the possibility of crisis, normal, and bullish to be 30%,50%, and 20% respectively. What is the expected return and standard deviation (total risk) of stock A? E (R) = 0.30 x ( -2%) + 0.50 x (4%) + 0.20 x (10%) E (R) = 3.4% SDA = [0.3 x(-2 - 3.4)2 + 0.5 x(4 - 3.4)2 + 0.2x(10 – 3.4)2 ]0.5 SDA = 4.2%
Portfolio • Portfolio: Group of assets such as stocks and bonds held by an investor. • Efficient portfolio : portfolio that maximize the expected return given a level of risk. • Optimal portfolio : the most preferred efficient portfolio that an investor selects. • Risk averse investor : with the same expected return but two different risks, he will prefer the lower risk.
Portfolio • Portfolio weights: Percentage of a portfolio's total value invested in a particular asset. • Portfolio expected returns: the weighted average combination of the expected returns of the assets in the portfolio. • Portfolio Variance:it is the combination of the weighted average of the individual security's variance and securities’ covariance factor.
Portfolio Expected Returns Two ways to calculate portfolio expected return: Xj = weight of each stock in the portfolio E(Rj) = expected return of each stock in the portfolio n = total number of different stocks in the portfolio E(Rps) = expected return of portfolio under state s Ps = Probability of state s m = total number of all states in the future
var(Rp) = Wi2 var(Ri) + Wj2 var (Rj) + 2WiWj cov(Ri,Rj) Portfolio Risk • Portfolio variance: cov (Ri, Rj) = p1[ri1 - E(Rj) ][rj1 – E(Rj)] + p2[ri2 - E(Rj) ][rj2 – E(Rj)] + …. + pN[riN - E(Rj) ][rjN – E(Rj)] Where ; rin and rjn = the nth possible rate of return for asset i and j respectively pn = the probability of attaining the rate of return n for assets i and j N = the number of possible outcomes for the rate of return
corr (Ri, Rj) = cov (Ri, Rj) SD(Ri) SD(Rj) Covariance and Correlation • Relationship between covariance and correlation: Correlation represent only the direction between two assets. It values between -1 to +1 Covariance represent both direction and magnitude between two assets.
Covariance and Correlation cov (Ri, Rj) = 0.50(15-11)( 8- 8) + 0.30(10-11)(11-8) + 0.13( 5 -11)( 6- 8) + 0.05( 0 -11)( 0- 8) + 0.02(-5-11)(-4- 8) = 8.90 corr (Ri, Rj) = 8.9 / [(4.91)(3.05)] = 0.60 • Calculating covariance and correlation :
9.53 12.81 3.58 Diversification! = (0.502)( 4.912) + (0.502)(3.052) + 2(0.50)(0.50)(8.90) = 0.50 x 11.05% + 0.50 x 8% Example: Portfolio Return and Risk
E(Rp) 5 30% 4 20% 3 2 10% 1 10% 20% 30% 40% 50% 60% SD(Rp) Feasible and Efficient Portfolios Figure 3.2 ; Feasible and efficient sets of portfolios for stocks C and D
E(Rp) Markowitz efficient frontier 30% 20% 6 10% 10% 20% 30% 40% 50% 60% SD(Rp) Feasible and Efficient Portfolios Figure 3.2 ; Feasible and efficient sets of portfolios for stocks C and D 1 is not include in Markowitz efficient set Because it was dominated by 2,3, and 4 Space on the left side of 2,3,4, and 5 are not attainable from combinations of C and D. Space on the right side of 2,3,4, and 5 are not include in Markowitz efficient set. i.e. 6 has same return as 2 but 6 gives higher risk. In another word, 6 has same risk as 4 but 6 gives lower return 5 4 3 2 1
The minimum-variance frontier of risky assets E(r) Efficient frontier Individual assets Global minimum variance portfolio Minimum variance frontier St. Dev.
Markowitz Efficient Frontier • Efficient Frontier: Set of portfolios with the maximum return for a given risk level. • Data needed to find Efficient Frontier: • Expected returns on all assets • Standard deviations on all assets • Correlation coefficients between every pair of assets
E(Rp) 30% 20% 10% 10% 20% 30% 40% 50% 60% SD(Rp) Feasible and Efficient Portfolios U3 Moving from left to right on the frontier, although risk increases, so does the expect return. Which point is the best portfolio to hold? The answer is optimal portfolio depend on the investor’s preference or utility as the trade-off between risk and return. U2 U1 = Optimal portfolio U1,U2,U3 = Indifference curves with U1 < U2 < U3
Correlation Coefficient • Correlation: The tendency of the returns on two assets to move together. Corr(RA, RB) or A,B -1.0 +1.0 • Perfect positive correlation: +1.0 gives no risk reduction • Perfect negative correlation: -1.0 gives complete risk reduction • Correlation coefficient between -1.0 and +1.0 gives some, but not all, risk reduction • The smaller the correlation, the greater the risk reduction potential
Portfolio Diversification Diversification: Spreading an investment across a number of assets will eliminate some, but not all, of the risk.
Stock B Portfolio AB Stock A 0 0 0 Returns Distributions for Two Perfectly Positively Correlated Stocks ( = +1.0)
Stock A Stock B Portfolio AB 0 0 0 Returns Distribution for Two Perfectly Negatively Correlated Stocks ( = -1.0)
Risk & Return with 2 Assets E(r) 13% r = -1 r = 0 r = .3 r = -1 8% r = 1 12% 20% St. Dev
Problem 3 Use the following information to calculate the expected return and standard deviation of a portfolio that is 40% invested in Kuipers and 60% invested in SuCo. KuipersSuCo Expected return, E(R) 30% 28% Standard deviation , .65 .45 Correlation .30 E(RP) = .4 x (.30) + .6 x (.28) = 28.8% P = .402 x (.65)2 + .602 x (.45)2 + 2 (0.4)(0.6)(0.65 x .45 x .30 = (0.18262)1/2 = 42.73%
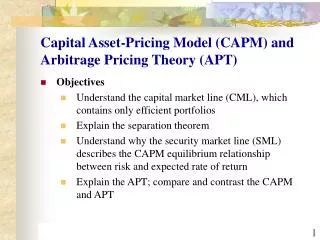
CAPM : Capital Asset Pricing Model • Assumptions ; 1.Two-Parameter Model : Investors rely on E(R) and Risk in making decision 2.Rational and Risk Averse : Investors are rational and risk averse. 3.One-Period Investment Horizon : Investors all invest for the same period of time 4.Homogeneous Expectations : Investors share all expectations about assets
CAPM : Capital Asset Pricing Model • Assumptions ; 5.Existence of a risk-free asset and unlimited borrowing and lending at the risk-free rate : Investors can borrow and lend any amount at the risk-free rate. 6.Capital markets are completely competitive and frictionless : The sufficiently large number of buyers&sellers. Also, no transaction costs.
CML : Capital Market Line From; Var(Rp) = (WRf)2 Var(Rf) + (Wm)2 Var(Rm) + 2WRfWmcov(Rf,Rm) Since, risk-free asset has no variability, and therefore does not move at all with the return on the market portfolio Var(Rp) = (Wm)2 Var(Rm) Wm = SD(Rp) / SD(Rm) From; E(Rp) = WRfRf + Wm E(Rm) ; which WRf + Wm = 1 E(Rp) = (1-Wm)Rf + Wm E(Rm) E(Rp)= Rf + Wm (E(Rm)- Rf ) Therefore, E(Rp)= Rf + [(E(Rm)- Rf )/ SD(Rm)] SD(Rp)
Capital market line:CML Rp = Rf + [(Rm - Rf )/ SD(Rm)] SD(Rp) Borrowing Portfolio Lending Portfolio Expected Return Efficient Frontier M Market Portfolio With a risk-free asset available and the efficient frontier identified, we choose the capital allocation line with the steepest slope Standard Deviation CML : Capital Market Line Every combination of the risk-free asset and the Markowitz efficient portfolio M is shown on the capital market line (CML) Rf
CML : Capital Market Line • Because investors have the same optimal risky portfolio given the risk-free rate, all investors have the same CML. What if they have different levels of risk-free rate? CML1 CML0 return 100% stocks Second Optimal Risky Portfolio First Optimal Risky Portfolio 100% bonds
the part of the information that the market uses to form the expectation, E(R). the news that influences the unanticipated return on the stock, U, real news which results in risk. Announcements & News Announcement = expected part + surprise
Expected Return or Unexpected Return Total Return = Expected Return + Unexpected Return Total Return - Expected Return = Unexpected Return
Risk: Systematic & Unsystematic • Risk: The unanticipated part of the return, the portion resulting from surprises. • Types of risk: • Systematic or “market” • Unsystematic or “unique” or “asset-specific” Risk that influences a large number of assets. Also called market risk. Risk that influences a single company or a small group of companies. Also called unique or asset-specific risk.
Components of Risk R - E(R) = Systematic portion + Unsystematic portion R - E(R) = U = m +
Total risk Company-specific risk Portfolio Risk - Std. Dev. Diversifiable risk Unsystematic risk Market Risk Non-diversifiable or Systematic risk Number of Stocks in Portfolio Components of Risk
Components of Risk • Unsystematic Risk: • “Unsystematic risk is essentially eliminated by diversification, so a portfolio with many assets has almost no unsystematic risk.” • Diversifiable risk / unique risk / asset-specific risk • Systematic Risk: • Systematic risk affects all assets and can not be diversified away (even in a larger portfolio). • Non diversifiable risk / market risk
Systematic Risk (Beta) • Systematic risk can not be eliminated by diversification. • Since unsystematic risk can be eliminated at no cost, there is no reward for bearing it. • Systematic Risk Principle: • Measuring Systematic Risk: Beta or The reward (expected return) for bearing risk depends only on the systematic risk of an investment. Measure of the relative systematic risk of an asset. Assets with betas larger (smaller) than 1 have more (less) systematic risk than market average and will have greater (lower) expected returns.
Beta Coefficients Beta Company Coefficient (i) Exxon 0.65 AT&T 0.90 IBM 0.95 Wal-Mart 1.10 General Motors 1.15 Microsoft 1.30 Harley-Davidson 1.65 America Online 2.40
Portfolio Beta With a large number of assets in a portfolio, multiply each asset's beta by its portfolio weight, and then sum the results to get the portfolio's beta:
Portfolio Beta Amount PortfolioStock Invested Weights Beta (1) (2) (3) (4) (3) x (4) Haskell Mfg. $ 6,000 50% 0.90 0.450 Cleaver, Inc. 4,000 33% 1.10 0.367 Rutherford Co. 2,000 17% 1.30 0.217 Portfolio $12,000 100% 1.034
Portfolio Beta • High beta security is more sensitive to market movements • Low beta security is relatively insensitive to market movements. • Sensitivity depends on: • How closely is the security’s return correlated with the market • How volatile the security is relative to the market
Portfolio Beta • Beta is computed as:
Characteristic Line Slope = bi Portfolio Beta • Beta is estimated as: Security Returns Return on market % Ri = ai + biRm + ei
Beta & Expected Return of a portfolio with one risky and one risk free asset • If you invest in WA in Asset A and the rest (1-WA) in Risk-Free Asset (with ß=0), then ßP = WAßA + (1 - WA) 0 = WAßA • If you own 40% in A with an expected return of 18%, with the remainder in the Risk-Free Asset with a 8% return. The beta on Asset A is 1.4. E(RP) = (0.40) (0.18) + (1 - 0.40) (0.08) = 12% ßP = WAßA + (1 - WA ) 0 = (0.40)(1.4) = 0.56
Why do Betas Differ? • Using daily, weekly, monthly, quarterly, or annual returns. • Estimating betas over short periods (a few weeks) versus long periods (5-10 years). • Choice of the market index (S&P 500 index versus all risky assets). • Some sources adjust betas for statistical and fundamental reasons (such as Value Line).
SML : Security Market Line E(Ri)= Rf + [(E(Rm)- Rf )/ SD(Rm)] SD(Ri) by assuming the unsystematic risk is zero and since, ,therefore, E(Ri)= Rf + [cov (Ri, Rm) / var(Rm )] (E(Rm)- Rf ) SML shows that it is not the variance or standard deviation of an asset that affects its return. Actually, Covariance of the asset’s return with the market’s return affects its return. From equation above, positive covariance implies higher expected return than the risk-free asset. However, with positive covariance, it increases the risk of an asset in a portfolio, that’s why investors will buy that asset only if they expect to earn a return higher than the risk-free asset.
SML : Security Market Line Assume you wish to hold a portfolio consisting of Asset A and a risk-less asset. Given the following information: Asset A has a beta of 1.2 and an expected return of 18%. The risk-free rate is 7%. Use Asset A weights of: 0%, 25%, 50%, 75%, and 100%.
SML : Security Market Line Proportion Proportion Invested in Portfolio Invested in Risk-Free Expected Portfolio Asset A (%) Asset (%) Return (%) Beta 0 100 7.00 0.00 25 75 9.75 0.30 50 50 12.50 0.60 75 25 15.25 0.90 100 0 18.00 1.20
Expected Returns & Betas for Asset A 25 Security market line (SML) 20 Expected Return 15 10 5 0 0 0.2 0.4 0.6 0.8 1 1.2 1.4 1.6 Beta SML : Security Market Line Graphical representation of the linear relationship between systematic risk and expected return in financial markets
Reward-to-Risk Ratio • Risk premium of X% per unit of systematic risk • Based on CAPM assumptions, the reward-to-risk ratio is the same for all securities. Hence,
SML : Security Market Line Asset Expected Return [E(Rj)] Slope of SML = [E(Rj) - Rf] / ßj or = [E(RM) - Rf] SML D E(RA) A E(RM) C Rf ßM= 1.0 ßA Asset Beta ßj