Download

1 / 23
230 likes | 333 Vues
Learn about Value-Added Assessment and its use in Louisiana education system, including history, methods, and impact on students and teachers.

E N D
Introduction to Value-Added Assessment and its Use in Louisiana Danielle Rowland, M.Ed. Louisiana Department of Education
Brief history of Value-Added *Origins in the business world *Levels the “playing field” to allow each employee’s contribution to be determined *William Sanders, Tennessee *In use in education for nearly 20 years Chicago, NYC, DC, Seattle, Dallas, Milwaukee, Los Angeles, Utah, Minnesota, Georgia, Colorado, Iowa, Arkansas, Kentucky, Ohio, Tennessee, North Carolina, South Carolina, Delaware, Pennsylvania
Value-Added in Education • Assess Actual Achievement • (not achievement levels) • Determine Average Achievement for Students with Similar Prior Test Histories and Key Factors • Compare Actual Achievement to • Average Results for Students with Similar Histories and Factors • Provide the Information to Responsible Educators and Leadership
CVR - Verifying Rosters O N E B O X
Which Students are Included inLouisiana’s Value-Added Assessments? Students are Included in the Assessment if…… Students are Excluded from the Assessment if……. Prior Achievement Data Available No Prior Achievement Data Available Attended School Requisite Time Period (majority of year) Moved In or Out During School Year Take Regular State Assessments Grades 4-8 Core Content Areas (and EOC courses) Take Alternate State Assessments (LAA-1 or LAA-2) Teacher Agrees He/She Taught the Student Grades K-3 or 9-12
What Information is Used to Determine “Typical”Achievement for Students? Prior Achievement on State Assessments (ELA, Reading, Math, Science, Social Studies) Student Attendance Discipline Record (Count of Suspensions and/or Expulsions Disability Status (ED, Speech/Language, MMD, SLD, OHI, Other) English Language Learning Free/Reduced Lunch Status Section 504 Status Gifted Status Note: Value-Added Assessment is Based on a Mathematical Model that Determines How Much Each Factor Contributes to Estimating Expected Student Achievement. By Far, the Strongest Predictor is Prior Achievement.
What Classroom Information is Used? • Class composition can make a difference in how challenging a group of students is to teach • This is accounted for by including the variables below: *Percentage of students receiving free lunch *Percentage of students receiving Special Education accommodations *Students’ mean prior achievement in the content area *Average number of days students were suspended
Sample Formula & Calculation8th grade student; Math 2009-2010 MATH10=(ED*ED_co) + (SLD*SLD_co) + (MMR*MMR_co) + (OHI*OHI_co) + (SLD*SLD_co) + (SPED*SPED_co) + (FLS*FLS_co) + (RLS*RLS_co) + (LEP*LEP_co) + (GS*GS_co) + (S504*S504_co) + (Sab*Sab_co) + (PSC*PSC_co) + (PEC*PEC_co) + (ZELA0809*ZELA8090_co) + (ZRDG0809*ZRDG0809_co) + (ZMTH0809*ZMTH0809_co) + (ZSCI0809*ZSCI0809_co) + (ZSS0809*ZSS0809_co) + (ZELA0708*ZELA0708_co) + (ZRDG0708*ZRDG0708_co) + (ZMTH0708*ZMTH0708_co) + (ZSCI0708*ZSCI0708_co) + (ZSS0708*ZSS0708_co) + (ZELA0607*ZELA0607_co) + (ZRDG0607*ZRDG0607_co) + (ZMTH0607*ZMTH0607_co) + (ZSCI0607*ZSCI0607_co) + (ZSS0607*ZSS0607_co) ****************************************************************************** Regression coefficient analysis will be conducted every year; therefore the weighting for the predictor variables will change, slightly, from year to year. ****************************************************************************** Zscore= x – mean of x Standard Deviation
Sample Teacher Results Report—Single Content • Updated for 2011-2012
Sample Teacher Results Report • Multiple Content Areas
Sample Teacher Results Report Student & Teacher Achievement Results What is the Student & Teacher Achievement Results Report?
Sample Teacher Results Report Student & Teacher Achievement Results What is the Student & Teacher Achievement Results Report?
Sample Teacher Results Report: • Principal’s View of All Teachers Student & Teacher Achievement Results What is the Student & Teacher Achievement Results Report?
Value-Added in Louisiana 2009: Legislature provided funding for initial Pilot Program 2009-2010: 24 schools * focused on data analysis and reporting tools 2010: Legislature passed Act 54; Pilot Program expanded; ACEE 2010-2011: 20 districts (approximately 400 schools) * focused on training and large-scale information deployment * Value-Added score reports (2009-2010 testing) 2011-2012: Statewide deployment *Value-Added score reports to ALL public schools *statewide training on results and use of CVR portal 2012-2013: Statewide implementation *Use of Value-Added results in teacher, administrator and public school evaluations
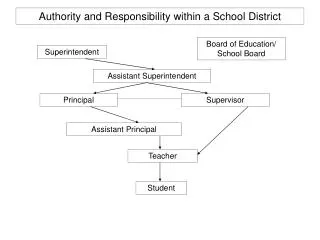
ACEE Advisory Committee for Educator Evaluations *Created by Legislature—Mandated in Act 54 *Composed of educators and other stakeholders -71% educators; 75% of those currently in classroom -Parents of students currently enrolled in La public schools -Heads of educator groups (unions, principals, superintendents…) *Meets bi-monthly; communicates regularly *Making recommendations around Value-Added and NTGS -final recommendations in Spring of 2012
CVR Schedule *Roster verification dates change yearly, as this process will always immediately follow testing
Plans for 2011-2012 *Statewide deployment of Value-Added Scores to all schools *Virtual Workshops on: -General Value-Added information -Reading and Interpreting Score Reports -Registering for and Using the CVR -How Value-Added Information can be utilized *Webinars, Workshops, In-person audiences *All appropriate teachers will verify rosters in Spring 2012 *Value-Added data collected Spring and Summer 2012 *Value-Added Score Reports generated for all based on 2012 testing **NTGS Pilot in 10 districts**
Plans for 2012-2013 Teacher Evaluations *50% Principal Observations *50% Student Progress Data Value-Added Measures NTGS Growth Measures Administrator Evaluations School Performance Scores
Possible Uses for Value-Added Assessment Results Create Professional Learning Communities Partner Teachers Individualize Professional Development Changes to Curricula and Instructional Materials Evaluate Effectiveness of Specific Programs Monitor Implementation of Curricula or the Use of Resources Celebrate Successes Identify and Correct Gaps in Curricula Identify Areas of Concern in Content Knowledge of Teachers Assign/reassign Students to Teachers Communicate with Parents and Community